
The Cost of Routine Immunization Services in A Poor Urban Setting in Kampala, Uganda: Findings of a Facility-Based Costing Study
Isaiah Chebrot1,2, Annet Kisakye3, Brendan Kwesiga4, Daniel Okello5, Diana Kiiza6, Eva Kabwongera7, Robert Basaza1*
1International Health Sciences University, Uganda
2Kawempe Division Health Office, Kampala City, Uganda
3World Health Organization, Uganda Country Office, Uganda
4USAID/Management Science for Health, Kampala, Uganda
5Directorate of Public Health and Environment, Kampala City, Uganda
6Health Economist, Elma philanthropies EA, Kampala, Uganda
7United Nations Child Fund, Uganda Country Office, Uganda
Abstract
Background: Reducing infant and under-five mortality by use of cost-effective strategies like immunization continues to be a challenge, particularly in resource limited settings. Strategic planning for immunization requires credible costing information to estimate available funding, allocate funds within the program and avoid funding shortfalls. This study assessed the total and unit costs of providing routine immunization in health facilities in Kampala.
Methods: This was a retrospective descriptive cost analysis study that applied a bottom-up, ingredients-based costing methodology which identified costs from the perspective of the health service providers. The cost of providing immunization services in health facilities in Kawempe Division in the financial year 2015/2016 was determined using relevant data which was collected using an Excel questionnaire adapted from the CostIt software of the World Health Organization. The analysis was also based on the same CostIt software.
Results: The average total facility immunization costs were USD 14,415.1 with a range of 8,205.3 at private for profit to USD 47,094.9 at public health facilities. Vaccines and supplies were the main cost driver accounting for 63.6% followed by personnel costs at 24.0%. Routine facility based immunization had the highest cost with an average of 47.9% followed by outreach services at 32.3%. The average cost per dose administered was USD 1.4 with a range of USD 1.0 in larger health centres (HCIV) to 1.5 in HCIII (medium-sized HC or dispensary). The average cost per DPT3 immunized child was USD 20.0 with a range of USD 12.6 in HCIV to 22.0 in HCIII. The findings show a great variance between facility ownership and levels.
Conclusions: The study found that the recurrent costs were significantly higher than capital costs and this was across all facilities. Vaccines and personnel costs were the two main cost drivers. Routine facility based immunization was the costliest activity followed by outreaches with social mobilization being the least. The cost per dose administered and DPT3 immunized child were dependent on outputs with high output health facilities having less unit costs compared to facilities with less out outputs. Private health facilities had higher unit costs compared to publicly owned health facility.
Abbreviations
PNFP- Private Not for Profit; PFP- Private for Profit; HC-Health Center; KCCA- Kampala Capital City Authority; MOH- Ministry of Health; cMYP- comprehensive Multi-Year Plan; USD- United States Dollars.
Introduction
Immunization is one of the most successful and cost-effective health interventions known for preventing over 2 million deaths annually1. However, World Health Organization points out that reduction of infant and under-five mortality by use of costeffective strategies like immunization remains a challenge, particularly in developing countries2,3. Routine immunization (RI) is important and a sustainable RI system is a basis for strong EPI. Thus RI includes services delivered in health facilities (static services) as well as outreach services provided in homes or separate locations in scheduled days4. Countries like Uganda face challenges of planning for sustainable financing of RI due to lack of reliable cost information. Immunization services in Uganda are implemented with the goal of ensuring that every child and high-risk group are fully vaccinated with high quality and effective vaccines against the target diseases according to recommended strategies4. The Uganda Ministry of Health points out that most health units in the country are facing challenges of inadequate resources a midst increasing demand for quality health services5,6,7. The Uganda Demographic and Housing Survey (UDHS) 2016 points out that the infant mortality rate is 43/1,000 live births while the child mortality rate is 22 deaths per 1,000 children and the overall under five mortality being 64 deaths per 1,000 live births8.
It is recognized that proper planning for immunization services requires credible costing information to achieve program objectives, estimate available funding, allocate funds within the program and avoid funding shortfalls9,10. Costing information also helps in advocacy and resource mobilization for vaccination and immunization from ministries like that of Finance, Economic Planning and Development and donors while improving efficiency and effectiveness.
The Ministry of Health (MOH) of Uganda implements immunization through the Uganda National Expanded Programme on Immunisation (UNEPI) which was officially launched in October 1983 with a mandate of ensuring full immunisation of infants and women of childbearing age4,11. Currently, Uganda has ten vaccines into its immunization schedule provided free of charge in health facilities. In this study we costed all the vaccines of UNEPI. These vaccines include: BCG, polio, diphtheria, pertussis, tetanus, Hepatitis B and haemophilus vaccines. Others are measles, pneumococcal conjugate vaccine10, and Human Papilloma Virus vaccines as well as tetanus toxoid for pregnant women and women of child bearing age11. Immunization services in Uganda are managed at national, district, health sub-district and health facility with different roles at each level4. The national level is responsible for developing policy, standards and priorities; building capacity; coordination and networking; resource mobilization; procurement of vaccines and equipment; and monitoring and technical support supervision to districts. The district and health subdistricts undertake the planning and management of service delivery; supervision of health units; in-service training; and ensure effective district and health facility reporting and monitoring systems. The health facilities, of all types (both hospitals and health centres) are responsible for the actual delivery of immunization services as an integrated element in routine health services, either facility-based or through outreach activities. There are also private and not-for-profit health facilities that provide RI services4.
Literature on costs of immunization services in Uganda are limited, a study carried out in Uganda showed that the average health facility costs was USD 8,772 with recurrent costs contributing 83.4% and capital costs taking 16.4%12. Of the recurrent costs, vaccines contributed 39% and salaries at 32% with the rest being shared by cold chain maintenance, vehicle maintenance, vaccine injections and supplies. The same study further established that of the 16.4% attributed to capital items, the largest went to vehicles at 9.3% followed by building costs at 5.1% with cold chain equipment contributing 1.813. In the study of estimating the costs of the vaccine supply chain and service delivery for selected districts in Kenya and Tanzania, the average annual cost per dose was 1.33USD and 2.82 USD respectively13. Whereas immunization is supposed to be at no charge to the children, a study by Babirye and others found that most health facilities charged some illegal fees which consequently became a barrier to uptake of immunization services14.
Most of the previous costing studies and studies elsewhere in Kenya and Tanzania all do not focus on an urban poor setting12,13,15. In Uganda, there has never been any elaborate studies on cost of routine immunization services at district level and more so, in an urban setting by ownership of the facilities. The main objective of this study was to assess the costs of providing routine immunization services in 2015/2016 in health facilities in a poor urban setting in Kampala, Uganda. Specifically, the study sought to assess the total and unit costs of providing routine immunization services in health facilities in the poor urban setting. The study also compared the cost of providing immunization services at the static and outreach sites, levels of health facilities and between private and public facilities.
Methods
Study design
The study was a retrospective descriptive cost analysis study which applied a bottomup, ingredients-based costing which identified costs from the perspective of the health service providers. The cost of providing RI services in health facilities in Kawempe Division in the government financial year 2015/2016 was determined using relevant data from July 2015 to June 2016. The ingredients approach identified the type of inputs, quantified the number of inputs, and multiplied by unit prices and the proportion used for RI.
Table 1 summarises the quantification method and the approach to valuation for each expenditure line item that was used for calculating and reporting costs in this study. This approach was used by Guthrine and others in their study of costing and financing analyses of routine immunization in Uganda12. We modified Brenzel, Logan (2013)18 framework to our local context.This study excludes costs of supplementary immunization activities.
Table 1: Expenditure line items, resource quantification and valuation methods
| Expenditure line item | Quantification method | Valuation method |
|---|---|---|
| Recurrent Costs | ||
| Personnel costs | Immunization staff allocated hours to various immunization activities over the period of a month. Where non-clinical staff directly support the EPI, their time was included and quantified on the basis of hours allocated to EPI per month. Human resource costs of administrative staff were allocated to the EPI depending on the hours spent on EPI over a month period. Per diem and safari day allowances were quantified on the basis of days or nights spent away from the facility on immunization related activities. |
Annual remuneration was defined as the total cost to the employer including benefits and allowances. Actual expenditure on per diems and allowances were used. |
| Vaccines and supplies costs | For facilities that had accurate records of vaccines consumed and wasted, these were used. Where facilities had poor vaccine records, the cost of vaccines were calculated on the basis of doses administered and WHO wastage factors. | Unit costs for vaccines were obtained from Ministry of Health as used in the comprehensive multi-year plan (cMYP). |
| Utilities | Interview data on procurement of power, gas and water, was used to quantify consumption. | Prices for water, gas and electricity consumption were used. |
| Other supplies | Other supplies were any other expenditures which could have not been included under other line items. | Other supplies were valued based on actual expenditure reported. |
| Transport operating costs | Transport and fuel included bus and taxi fares (where used), as well as fuel consumed by vehicles and motorcycles. Quantification was based on actual reported vehicle maintenance costs. | Values for bus and taxi fares were provided by each facility. Vehicle maintenance was valued at actual expenditure incurred. |
| Maintenance costs | Costs incurred for maintenance of buildings. | Actual expenditure on maintenance was recorded. |
| Equipment operating costs | Maintenance of cold chain equipment. | Actual expenditure recorded. |
| Capital costs | ||
| Cold chain equipment | Cold chain equipment was captured in the questionnaire. | Valuation of the equipment were based on the WHO price list for cold chain equipment. |
| Transport costs | Vehicles and motor cycles were captured in the questionnaire. | Current vehicle replacement costs were obtained from MOH. |
| Buildings | Space consumed were based on the measurement of facility space dedicated to the EPI (m2). | Each square meter (m2 ) of area was valued at $540, the standard MOH replacement cost of health facility type buildings. |
| Furniture costs | Furniture was captured in the questionnaire | Actual expenditure captured |
Source: A modification from the Brenzel, Logan (2013)
An overview of functional activities and the expenditure items allocated to each activity are presented in Table 2.
Table 2: Overview of functional activities and allocation methods
| Activity name | Expenditure items included in the activity | Allocation method |
|---|---|---|
| Routine facility-based service delivery | Time allocated by EPI staff, vaccines and injection supplies for facility immunizations and facility building costs. | Staff were asked to allocate their time to activities. Vaccine records were used to estimate the portion of total immunizations provided at the facility and were used to allocate costs. |
| Outreach services | Time allocated by EPI staff, vaccines and injection supplies for outreach immunizations. | Staff were asked to allocate their time of all immunizations carried out during outreach activities. Vaccine records were used to estimate the portion of total immunizations provided through outreach and were used to allocate costs. |
| Social mobilization | Staff time, transport and fuel costs and travel allowances. | Staffs were asked to identify any travel costs specifically associated with social mobilization. |
| Cold chain maintenance | Cold chain maintenance included staff time, operating costs (energy costs) and costs of any repairs. | Staff time worked out as above. Energy costs for cold chain were calculated. Repair costs were included where they were reported. |
| Vaccine collection, distribution and storage | Staff time, transport and fuel costs and travel allowances. Capital costs of cold chain equipment were allocated to this activity. | Staff time worked out as above. Respondents were asked to identify any travel costs specifically associated with vaccine collection and distribution. |
| Program management and supervision | Staff time, cost of office equipment, travel allowances, transport and fuel costs. Record keeping / HMIS and training costs. | Staff time worked out as above. Respondents were asked to identify any travel costs specifically associated with program management, supervision and training. |
Study site
Kawempe Division is one of the five5 divisions that make up Kampala City with a surface area of 39 sq. Km out of the city surface area of 195sq. Km15. “It was purposively selected for this study because it had a high level of poverty and poor service delivery indicators compared with the entire Kampala City”. A comparison of a select list of indicators in Kawempe, the city and country respectively as indicated in the 2014 National Population and Housing Census is: poverty level based on less than two meals a day is 15.4% (for Kawempe and the city) and country at 11.1%); Out-patient utilization per capita per year 1.5 (2.4 and 1.2) safe water coverage is 92% (94.1% and 71.2%), the literacy rate is 82% (82% and 70%); ownership of dwellings/house is 20.9% (20.4 and 72.8%)8.
The population of the Division as extrapolated from the 2014 census is 338,312 people with 159,800 males and 178,512 females. There are 16,900 infants while 71,435 are children under five years of age and 17,423 are pregnant women8. The Health Management Information System (HMIS) reports indicate that there were 11 health facilities (both public and private) providing static immunization services in Kawempe Division from the start of FY 2015/16 but only seven were providing both static and outreach immunization services16.
Data collection
The main sources of data were financial reports, immunization registers, vaccine stock and issue registers and interviews with key staffs. Vaccine prices were adapted from the Comprehensive Multi-year Plan for MOH11 while the price catalogue was obtained from immunization supply chain sizing tool17. The common approach provided two stages of determining sample size18. All the seven health facilities providing static and outreach immunization services were included in the study. Cost information of different inputs and resources used in financial year 2015/16 were collected by an experienced and trained data collection team which was familiar with costing services using a pretested Excel questionnaire adapted from the CostIt software of the World Health Organization19.
Data analysis
The analysis was based on the World Health Organization's CostIt software. For costing the vaccines and supplies, the prices were adapted from the MOH cMYP 2016-202011. Capital costs were annualized using a discount rate of 3%, and the useful life of buildings and equipment were assumed to be 33 years and 10 years respectively. Unit costs of RI services were calculated by dividing the costs of inputs incurred along each of the services during the year by the total number of output of the respective services. All costs were captured in the local currency and converted to USD using the current mid-year exchange rate (1USD = UGX 3,590.24)20.
Results
Total costs by facility ownership and level
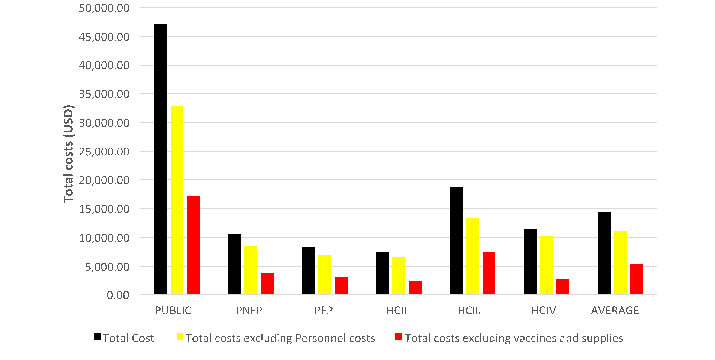
The total facility costs by facility ownership and level are presented in Figure 1.
Source: Facility data collected by authors
Figure 1. Total facility costs by ownership and level
The average total facility immunization costs were USD 14,415.1 with a range of USD 8,205.3 at private for profit to USD 47,094.9 at public while private not for profit had USD 10,494.7. Across facility levels, the costs were USD 7,348.4 at Health Centre (HC) II to USD 18,696.8 HCIII while HCIV was USD 11,421.5. Excluding personnel costs reduces the total costs to USD 10,952.4 with a range of USD 6,791.3 at PFP to USD 32,766.7 at the Public and USD 8,367.5 at PNFP had and USD 6,541.5 at HCII to USD 13,369.5 at HCIII while HCIV had USD 10,106.0. Excluding the costs of vaccines and supplies, the total cost was USD 5,252.8 at PFP to USD 17,065.6 at a public owned facility while PNFP had USD 3,686.1 and USD 2,285.2 at HCII to USD 7,775.9 at HCIII while HCIV had USD 2,695.4.
Cost structure by facility ownership and line ítems
The cost structure by facility level and ownership and line items is presented in Table 3.
Table 3: Cost structure by facility ownership and line items
| Item | Facility ownership | Facility level | Total | ||||
|---|---|---|---|---|---|---|---|
| PUBLIC | PNFP | PFP | HCII | HCIII | HCIV | ||
| Recurrent Cost (%) | 95.1 | 91.3 | 83.6 | 85.4 | 91.2 | 93.4 | 90.6 |
| Vaccines and supplies | 63.8 | 64.9 | 62.4 | 68.9 | 60.5 | 76.4 | 63.6 |
| Personnel costs | 30.4 | 20.3 | 17.2 | 11 | 28.5 | 11.5 | 24 |
| Utilities | 0.5 | 2.7 | 1.9 | 2.9 | 1.1 | 1.8 | 1.4 |
| Maintenance | 0.2 | 2.2 | 1.1 | 1.4 | 0.6 | 2.6 | 0.9 |
| Transport operating costs | 0.2 | 1.3 | 0.9 | 1.1 | 0.5 | 1.2 | 0.6 |
| Other recurrent items | 0 | 0 | 0 | 0 | 0 | 0 | 0 |
| Capital Cost (%) | 4.9 | 8.7 | 16.6 | 14.6 | 8.8 | 6.6 | 9.4 |
| Building costs | 3.7 | 7.3 | 14.6 | 12.5 | 7.5 | 5.4 | 8 |
| Cold chain equipment costs | 1 | 1.1 | 1.4 | 1.5 | 1.1 | 1 | 1.2 |
| Furniture costs | 0.2 | 0.3 | 0.5 | 0.6 | 0.2 | 0.2 | 0.3 |
| Transport costs | 0 | 0 | 0 | 0 | 0 | 0 | 0 |
| Other capital costs | 0 | 0 | 0 | 0 | 0 | 0 | 0 |
| Total Cost (%) | 100 | 100 | 100.0 | 100 | 100 | 100.0 | 100.0 |
| Total costs excluding personnel costs | 69.6 | 79.7 | 82.8 | 89 | 71.5 | 88.5 | 76 |
| Total costs excluding vaccines and supplies | 36.2 | 35.1 | 37.6 | 31.1 | 39.5 | 23.6 | 36.4 |
| Source: Facility data collected by authors | |||||||
Vaccines and supplies were the main cost drivers accounting for 63.6% followed by personnel costs at 24.0%. Other recurrent costs were: utilities at 1.4%, maintenance costs at 0.9% and transport operating costs at 0.6%. Of the total capital costs, building costs were highest at 8.0% followed by cold chain equipment at 1.2% and the remaining 0.3% being furniture. There were no capital costs on vehicles.
Cost structure by facility ownership and level and immunization activities
The cost structure by health facility ownership and level and immunization activities are presented in Table 4.
Table 4: Cost structure by facility type and immunization activities
| Activity | Facility ownership | Facility level | Total | ||||
|---|---|---|---|---|---|---|---|
| PUBLIC | PNFP | PFP | HCII | HCIII | HCIV | ||
| Number of health facilities | 1 | 2 | 4 | 2 | 4 | 1 | 7 |
| Routine facility-based Immunization (static services) | 41.00% | 50.70% | 55.90% | 63.50% | 44.00% | 52.90% | 47.90% |
| Outreach services | 42.60% | 29.70% | 19.20% | 17.30% | 34.90% | 34.80% | 32.30% |
| Cold chain maintenance | 5.40% | 7.60% | 11.90% | 9.70% | 7.90% | 5.80% | 8.00% |
| Social mobilization | 2.30% | 2.40% | 2.80% | 1.10% | 2.90% | 1.50% | 2.50% |
| Program management, training and supervision | 7.50% | 6.40% | 6.80% | 5.40% | 8.00% | 3.20% | 7.10% |
| Vaccine collection, distribution and storage | 1.30% | 3.10% | 3.40% | 3.00% | 2.30% | 1.80% | 2.30% |
| Total (%) | 100 | 100 | 100 | 100 | 100 | 100 | 100 |
| Source: Facility data collected by authors | |||||||
Routine facility based immunization had the highest cost taking an average of 47.9% of the total facility costs on RI followed by outreach services at 32.3%. The others were: cold chain maintenance 8.0%, program management 7.1%, vaccine collection, storage and distribution 2.3%, and 2.5% for social mobilization. However, the public health facility had more costs at the outreach of 42.6% compared to 41.0% at the static. This was different from the trend in all other types which had more at the static than at the outreach. The cold chain maintenance costs at PNFP and PFP were higher: 7.6% and 11.9% respectively compared to only 5.4% in the public facility.
Unit costs of providing routine immunization services
The unit costs per dose by facility ownership and level are presented in Table 5.
Table 5: Unit costs per dose by facility ownership and level
| Unit costs (USD) | Facility ownership | Facility level | Total | ||||
|---|---|---|---|---|---|---|---|
| PUBLIC | PNFP | PFP | HCII | HCIII | HCIV | ||
| No. of facilities | 1 | 2 | 4 | 2 | 4 | 1 | |
| Cost per dose at outreach | 2.4 | 3.9 | 9.1 | 27.3 | 3.2 | 2.3 | 3.5 |
| Cost per dose at static | 2 | 1.9 | 1.6 | 1.4 | 2 | 1.6 | 1.8 |
| Total cost per dose | 1.1 | 1.5 | 1.4 | 1.3 | 1.5 | 1 | 1.4 |
| Cost per dose at outreach | |||||||
| excluding vaccine costs | 0.9 | 1.4 | 3.4 8.5 | 1.3 | 0.5 | 1.3 | |
| Cost per dose excluding | |||||||
| personnel costs | 0.8 | 1.2 | 1.2 | 1.2 | 1.1 | 0.8 | 1.1 |
| Cost per dose at static | |||||||
| excluding vaccine costs | 0.7 | 0.7 | 0.6 | 0.4 | 0.8 | 0.4 | 0.7 |
| Cost per dose excluding | |||||||
| vaccines and supplies | 0.4 | 0.6 | 0.5 | 0.4 | 0.7 | 0.2 | 0.5 |
| Source: Facility data collected by authors | |||||||
The average cost per dose administered was USD 1.4 with a range of USD 1.0 in HCIV to USD 1.5 in HCIII while the cost at HCII was USD 1.3 Public had USD 1.1 while PNFP and PFP each had USD 1.5 and USD 1.4 respectively. When personnel costs were excluded, the service delivery costs per dose administered was USD 1.1 when vaccine costs were excluded, the average cost per dose was USD 0.5 the cost per dose at outreach site was twice the cost at static site.
Unit costs per DPT3 immunized child by facility ownership and level
The unit costs per DPT3 immunized child by facility ownership and level are presented in Table 6.
Table 6: Unit costs per DPT3 immunized child by facility ownership and level
| Unit costs (USD) | Facility ownership | Facility level | Total | ||||
| PUBLIC | PNFP | PPFP | HCII | HCIII | HCIV | ||
| Total cost per DPT3 vaccinated child | 17.1 | 22.4 | 19.6 | 19.9 | 22.0 | 12.6 | 20.0 |
| Total costs per DPT3 vaccinated child excluding personnel | 11.9 | 16.7 | 16.6 | 18.1 | 16.1 | 11.2 | 16.0 |
| Total costs per DPT3 vaccinated child excluding vaccines and supplies costs | 6.2 | 9.4 | 7.3 | 6.1 | 9.7 | 3.0 | 7.7 |
| Source: Facility data collected authors | |||||||
The average cost per DPT3 immunized child was USD 20.0 with a range of USD 12.6 in HCIV to 22.0 in HCIII while the cost at HCII was USD 19.9. Public had USD 17.1 while PNFP and PFP each had USD 22.4 and USD 19.6 respectively. When personnel costs are excluded, the average service delivery costs per DPT3 immunized child was USD 16.0 with HCII, HCIII and HCIV having USD 18.1, USD 16.1 and USD 11.2 respectively while the corresponding amounts for public, PNFP and PFP facilities were USD 11.9, USD 16.7 and USD 16.6. When vaccine costs were excluded, the average cost per DPT3 immunized child was USD 7.7 with HCII, HCIII and HCIV respectively having USD 6.1, 9.7 and USD3.0 while public, PNFP and PFP each had USD 6.2, USD 9.4 and USD 7.3 respectively.
Discussions
Results from this study indicate that there is a difference in total costs of providing immunization services between the level and type of facility. The high recurrent costs at 90.9% compared to capital costs at 9.1% is consistent with most studies12,13. All health facilities were receiving vaccines from MOH through the local authority, excluding vaccine costs implied the most expensive cost was in personnel which is similar to the cMYP and other studies11,12.
The results also indicate that routine facility based immunization had the highest cost taking 50.2% of the total costs followed by outreach services at 30%. This means over 80% of costs go to service delivery and only under 20% for program management and overhead costs. The cost of cold chain maintenance in PFP form 11.9% compared to 5.4% in public facilities. This is attributed to higher costs of cold chain technicians in the PFP. These figures are consistent with results of other studies. For instance, in a costing study of routine immunization in Viet Nam, recurrent costs constituted 93.4% while capital costs constituted 6.6%21. A study in Benin found that recurrent costs took 62.51% with personnel and vaccine costs taking 36.54% and 11.35% respectively of the total costs22. A similar study carried out in Uganda found that the average facility costs was USD 8,772 with recurrent costs contributing 83.4% and capital costs taking 16.4%12. This Benin study further found that of the recurrent costs, the vaccines and personnel costs contributed 39%and 32% respectively with the rest being shared by cold chain maintenance, vehicle maintenance, vaccine materials and supplies. This study also established that of the 16.4% attributed to capital costs, the largest expenditure was on vehicles at 9.3% followed by building costs at 5.1% with cold chain equipment contributing 1.8%. In the Uganda costed multi- year plan of 2014, personnel costs were 80% while vaccine costs were 15%11.
The study shows that the trend of cost per dose administered is similar to that of Guthrie et al. in their study of costing and financing analysis of routine immunization in Uganda12. A study by Van Hoang et al found that the average cost per dose of vaccine was USD 0.621. Mvundura et al (2015) in their study of estimating the costs of the vaccine supply chain and service delivery for selected districts in Kenya and Tanzania found that the average annual cost per dose was USD 1.33 and USD 2.82 respectively13. This implies the unit cost of providing immunization services is higher at the lower level compared to higher levels. A study by Van Hoang et al found that the average cost per dose of vaccine was USD 4.8121. Ownership of health facilities is critical especially that it determines its funding sources.
In this study, the cost per dose at outreach is highest in PFP (USD 9.1) compared with the USD 3.9 in PNFP and USD 2.4 in public owned facilities. This is attributed to the higher outputs of services in public sector compared to the lower output in the private sector. Also the high cost of labour in the private sector compared to the public sector is responsible for the higher cost per dose at outreach. In regard to levels of health facilities, the costs were highest at HCII because of the low levels of outputs.
The study findings of cost per dose administered of USD 1.17 is similar to findings from Kenya and Tanzania. Mvundura et al (2015) in their study of estimating the costs of the vaccine supply chain and service delivery for selected districts in Kenya and Tanzania found that the average annual cost per dose was USD 1.33 and USD 2.82 respectively24 which are consistent with the findings of this study.
The results also indicate that the unit costs per DPT3 immunized child was USD 18.34. These unit costs are lower than those found by Guthrie et al. in their study of costing and financing analysis of routine immunization in Uganda which found that the facility cost per DPT3 immunized child was USD 31.25, non-wage DPT3 cost per child was USD 22.63 and when all vaccine costs were excluded, the unit cost per DPT3 was USD 11.9612.
“The drivers for differences in cost by facility ownership are vaccines, supplies and labor costs. The labour costs are higher in public facilities than in the private ones. This is attributed to more staff in public than in private who conduct static and outreaches because of wider health facility catchment area. Consequently, public facilities use more vaccines and supplies”.
Study strength and limitations
This is the first facility-based costing study of immunization services conducted at sub-National level in a poor urban setting. It provides rich data that could be used in the bottom up planning to estimate the costs of immunization service delivery that could be used for resource mobilization by the national level. It could be used in bench marking results of future research.
There was some difficulty obtaining some relevant data like cost on buildings and cold chain equipment inventory. Whenever this challenge was faced, we used the same rates in a similar study by Brenzel18. Costs of immunization were not explored in private health facilities offering only outreach immunization services. The study was conducted in only static services and some of the services are provided in fewer health units with only outreach services. Sources of financing of immunization services were not explored which could have provided insight of who pays the costs of immunizing children in the study area. Personnel cost estimates could have been affected by recall bias related to a time spent on immunization activities, although efforts were made to minimize this bias by detailing every single activity time in the process of providing RI services. The study could have benefited from focus group discussions at the facility to reach consensus among staff and fully explore issues related costing of services especially administration of funds.
Conclusions
The study explored the total and unit costs of providing routine immunization in health facilities in a low income urban setting compared in different facility levels and facility ownership. Costs for specific items and immunization activities were assessed for each of the facilities and compared by level and ownership of facility.
Recurrent costs were found to be significantly higher than capital costs and this was across all facilities, levels and types. Vaccines and personnel costs were the two main cost drivers. Routine facility based immunization was the costliest activity followed by outreaches with social mobilization being the least costly activity. However, outreach services were the costliest in the public facility compared to facility based immunization.
This can be explained by low outputs at outreaches and subsequently higher cost per dose. The costs of vaccine dose and DPT3 administered were generally lower at higher level facilities than lower ones. However, the cost per child vaccinated and per capita were higher at higher level facilities compared to lower level facilities.
In respect to ownership of facility, the costs per dose and DPT3 administered were lowest in public facilities followed by PNFP facilities and highest at PFP facilities. However, the cost per child vaccinated were lowest at PFP followed by PNFP and highest at public facility. In addition, facilities with lower outputs had higher unit costs since costs like cold chain maintenance, personnel costs remain constant irrespective of the children being immunized. Private health facilities had higher overhead costs like cold chain maintenance compared to outreaches.
“The unique contributions of this study are the comparison of costs by facility ownership. Secondly, this study provides costs of immunization in a setting of Kawempe which is the poorest Division in the City”. It provides a range of total unit costs per line item and immunization activities across health facilities, levels of facilities and by facility ownership. The health facility, Division, Kampala City Management, MOH Planners and other stakeholders could use the results of this study while planning and financing of routine immunization services which could impact on greater sustainability. Furthermore, research is needed to understand the financing of RI by ownership especially in PNFP and PFP. The Ministry of Health and Kampala Capital City Authority could consider delivery of vaccines and injection materials to all static sites as well as supporting private health facilities with funds for cold chain maintenance, utilities and transport.
Acknowledgements
Sincere appreciation to data collectors, supervisors, KCCA, facility managers and all staff who generously availed data.
Authors’ contribution
IC developed the study proposal, carried out data collection, analysis and interpretation, and provided a major contribution to the study report and manuscript writing. RB developed the study proposal, carried out data analysis and interpretation, and provided a major contribution to the study report and manuscript writing. AK, BK, DO, DK, EV: did data interpretation, provided a major contribution to the study report and manuscript writing. All authors agreed on the final draft.
Conflicts of interest: None
Appendix A: Nil Supplementary data
References
- World Health Organization Geneva. Strengthening Routine Immunization. 2016. http://www.who.int/immunization/diseases/poliomyelitis/endgame_objective2/routine_immunizati on/en/ [accessed 30 September 2016].
- World Health Organization Geneva. Global Vaccine Action Plan. 2013; 2011-2020.
- World Health Organization, Geneva .Immunization, Vaccines and Biologicals. 2014. http://www.who.int/immunization/programmes_systems/financing/countries/en/ [accessed 30 October 2016].
- Ministry of Health Uganda. Uganda Immunization Policy. 2014.
- Ministry of Health Uganda. Health Sector Strategic and Investment Plan. 2010. 2010/11-2014/15.
- Ministry of Health Uganda. Health Financing Strategy. 2015. 2015/16-2024/25.
- Ministry of Health. Health Sector Development Plan. Uganda 2015. 2015/16 - 2019/20.
- Uganda Bureau of Statistics Uganda. The National Population and Housing Census. 2016. 2014.
- World Health Organization Geneva. WHO Global Health Expenditure Atlas. 2014.
- World Health Organization Geneva. Alliance for Health Policy and Systems Research. 2005.
- Ministry of Health Uganda The Uganda National Expanded Programme on Immunization Multi Year Plan. 2016; 2016-2020.
- Guthrie Teresa. Costing and Financing Analyses of Routine Immunization in Uganda. Rivonia, South Africa: Health Development for Africa. 2014.
- Mvundura M, Lorenson K, Chweya A, et al. Estimating the costs of the vaccine supply chain and service delivery for selected districts in Kenya and Tanzania. Vol Vaccine. 2015. PMID: 25865467.
- Babirye JN, Engebretsen IM, Rutebemberwa E, et al. Urban settings do not ensure access to services: findings from the immunisation programme in Kampala Uganda. BMC Health Services Research. 2014. 14.111.
- Kawempe Division Urban Council Uganda. Five Year Strategic Plan. 2014.
- Kampala Capital City Authority, Uganda .Annual Health Report. 2016. 2015/2016.
- World Health Organization Geneva. Immunization Supply Sizing Tool. 2014. http://apps.who.int/immunization_standards/vaccine_quality/pqs_catalogue/categorypage.aspx?id_cat=17 . [accessed: October 2016.]
- Brenzel, Logan. Common Approach for the Costing and Financing of Routine Immunization and new Vaccines. Bill & Melinda Gates Foundation. 2013.
- Taghreed, Adam, Aikins, et al. CostIt software 2007. World Health Organization. 2007. www.who.int/choice. [accessed 28 August 2016].
- Bank of Uganda. Financial Markets- Major Foreign Exchange Rates. 2016. http://www.bou.or.ug/bou/interbank_forms.html. [accessed 10 September 2016].
- Hoang MV, Nguyen TB, Kim BG, et al. Cost of providing the expanded programme on immunization: findings from a facility-based study in Viet Nam. 2005.
- Kaucley, Landry, Levy, et al. Cost-effectiveness analysis of routine immunization and supplementary immunization activity for measles in a health district of Benin. 2015.
- World Health Organization Geneva. WHO guide for standardization of economic evaluations of immunization programmes. 2008.
- World Health Organization Geneva. Guidelines for estimating costs of introducing new vaccines into the national immunization system. 2002.
- World Health Organization Geneva. Comprehensive Multi-Year Planning: A Tool and User Guide for cMYP Costing and Financing. 2014.