
Immunogenetic Association of 127 Human Leukocyte Antigen (HLA) Alleles with 30 Cancers in Continental Western European Countries
Apostolos P. Georgopoulos1,2,3,4*, Lisa M. James1,2,3
1The HLA Research Group, Brain Sciences Center, Department of Veterans Affairs Health Care System, Minneapolis, MN, 55417, USA
2Department of Neuroscience, University of Minnesota Medical School, Minneapolis, MN 55455, USA
3Department of Psychiatry, University of Minnesota Medical School, Minneapolis, MN 55455, USA
4Department of Neurology, University of Minnesota Medical School, Minneapolis, MN 55455, USA
Abstract
Human leukocyte antigen (HLA) genes have been associated with susceptibility and protection against a number of cancers. Here we used an immunogenetic epidemiological approach to evaluate the overall influence of 127 HLA Class I and II alleles on 30 types of cancer. We found a preponderance of protective alleles (negatively correlated with cancer prevalences), especially for HLA Class I. Of the 30 cancers investigated, 13 were associated with mostly protective HLA effects whereas only 2 were associated with mostly susceptibility HLA alleles. Taken together, these findings highlight the broad influence of HLA on cancer and the complexity of HLA-cancer associations.
Introduction
Cancer is a leading cause of death worldwide and represents a major global burden with an estimated 19 million new cases annually, 8% of which are in Western Europe1. Consequently, identification of factors that promote cancer susceptibility and protection are of paramount importance. To that end, growing research has documented the influence of human leukocyte antigen (HLA) on various types of cancer2-5.
Two main classes of HLA, which are cell-surface proteins encoded by genes on chromosome 6, are instrumental in immune system surveillance and T-cell activation aimed at elimination of non-self (e.g., viral, bacterial) and mutated antigens including those produced by tumors4,6. HLA Class I molecules (HLA-A, B, C genes), expressed on nucleated cells, bind small peptides (8-10 amino acid residues) from proteolytically degraded cytosolic viruses, bacteria, and tumors to export them to the cell surface for presentation to CD8+ cytotoxic T cells, thereby signaling cell destruction. HLA Class II molecules (HLA-DPB1, DQB1, DRB1 genes), expressed on lymphocytes and professional antigen presenting cells (e.g., macrophages, dendritic cells, and monocytes), present larger peptides (12-22 amino acid residues) derived from endocytosed exogenous antigens to CD4+ T cells to initiate antibody production and adaptive immunity. HLA is the most highly polymorphic region of the human genome; that variability gives rise to alterations of the binding groove which impact binding affinity with and elimination of foreign antigens,7 and ultimately influence disease susceptibility8-11.
Variations in HLA have been found to influence cancer susceptibility2,11 and treatment response4,5. A recent study of HLA gene expression in 33 cancers documented variability in HLA gene expression across cancer types and demonstrated that HLA gene expression was significantly associated with survival and response to immune checkpoint blockade (ICB) therapy12. In addition, a recent population-genome-wide association study (GWAS) across 18 cancer types identified shared genetic basis of several cancer types including several single nucleotide polymorphisms (SNPs) in the HLA region13. Furthermore, HLA SNPs that are associated with increases in certain cancers were associated with decreases in other cancer types13, highlighting the complex associations between HLA and cancer. HLA genes are the most highly polymorphic of the human genome and, to our knowledge, the association of a large number of HLA alleles with several types of cancer have not been investigated. Here we adopted an immunogenetic epidemiological approach to evaluate the overall influence of 127 high-resolution HLA lass I and II alleles on the population prevalence of 30 cancers in 14 Continental Western European countries. For that purpose, we computed estimates of HLA protection on cancer and relied on their 95% confidence intervals14-18 to quantify outcomes of protection for individual alleles, allele groups (HLA Class I and II, genes, HLA supertypes), and individual cancers.
Materials and Methods
Prevalence of 30 cancers
The population prevalence of the 30 cancers named in Table 1 in 2016 was computed for each of the following 14 countries in Continental Western Europe (CWE): Austria, Belgium, Denmark, Finland, France, Germany, Greece, Italy, Netherlands, Portugal, Norway, Spain, Sweden, and Switzerland. Specifically, the total number of people with each cancer in each of the 14 CWE countries was identified from the Global Health Data Exchange19, a publicly available catalog of data from the Global Burden of Disease study, the most comprehensive worldwide epidemiological study of more than 350 diseases. The number of people with each cancer in each country was divided by the total population of each country in 2016 (Population Reference Bureau20) and expressed as a percentage (data given in the Appendix). We have previously shown that life expectancy for these countries are virtually identical21; therefore, life expectancy was not included in the current analyses.
Table 1: The 30 cancers studied. “Full name” is the name as it appears in the database8 from which the data were obtained. “Abbreviated name” is a shorter name used in this paper
|
|
Full name of cancer8 |
Abbreviated name |
|
1 |
Bladder cancer |
Bladder |
|
2 |
Brain and central nervous system cancer |
Brain |
|
3 |
Breast cancer |
Breast |
|
4 |
Cervical cancer |
Cervical |
|
5 |
Colon and rectum cancer |
Colorectal |
|
6 |
Esophageal cancer |
Esophageal |
|
7 |
Gallbladder and biliary tract cancer |
Gallbladder |
|
8 |
Hodgkin lymphoma |
Hodgkin |
|
9 |
Kidney cancer |
Kidney |
|
10 |
Larynx cancer |
Larynx |
|
11 |
Lip and oral cavity cancer |
Oral |
|
12 |
Liver cancer |
Liver |
|
13 |
Malignant skin melanoma |
Malignant melanoma |
|
14 |
Mesothelioma |
Mesothelioma |
|
15 |
Multiple myeloma |
Multiple myeloma |
|
16 |
Nasopharynx cancer |
Nasopharynx |
|
17 |
Neoplasms |
Neoplasms |
|
18 |
Non-Hodgkin lymphoma |
Non Hodgkin |
|
19 |
Non-melanoma skin cancer |
Non melanoma skin |
|
20 |
Non-melanoma skin cancer (basal-cell carcinoma) |
Non melanoma basal cell |
|
21 |
Non-melanoma skin cancer (squamous-cell carcinoma) |
Non melanoma squamous cell |
|
22 |
Other pharynx cancer |
Other Pharynx |
|
23 |
Ovarian cancer |
Ovarian |
|
24 |
Pancreatic cancer |
Pancreatic |
|
25 |
Prostate cancer |
Prostate |
|
26 |
Stomach cancer |
Stomach |
|
27 |
Testicular cancer |
Testicular |
|
28 |
Thyroid cancer |
Thyroid |
|
29 |
Tracheal, bronchus, and lung cancer |
Tracheal, bronchus and lung |
|
30 |
Uterine cancer |
Uterine |
HLA
The frequencies of all reported HLA alleles of classical genes of Class I (A, B, C) and Class II (DPB1, DQB1, DRB1) for each of the 14 CWE countries were retrieved from the website allelefrequencies.net (Estimation of Global Allele Frequencies)22,23 on October 20, 2020. As we reported previously24, there was a total of 2746 entries of alleles from the 14 CWE countries, of which 844 alleles occurred in at least one country (“distinct” alleles). Of those, 127 alleles occurred in 9 or more countries and were used in further analyses. This criterion is somewhat arbitrary but reasonable; it was partially validated in a previous study24. The distribution of those alleles to the HLA classes and their genes is given in Table 2.
Table 2: Distribution of 127 HLA alleles analyzed to Class and Genes.
|
|
Class I (N = 69 alleles) |
Class II (N = 58 alleles) |
||||
|
Gene |
A |
B |
C |
DPB1 |
DQB1 |
DRB1 |
|
Count |
20 |
36 |
13 |
15 |
14 |
29 |
In addition, alleles of Class I A and B genes were assigned to a supertype25. (Supertypes for gene C of Class I or any gene of Class II have not been described.) Of a total of 56 alleles of Class I A and B genes, 53 alleles could be assigned to supertypes based on the assignments provided by Sidney et al.25, namely all 20 A gene alleles and 33/36 B gene alleles; B*13:02, B*47:01 and B*49:01 were unassigned (Fig. 2 in ref25). The distribution of alleles into supertypes is given in Table 3, and individual details are given in Table 4.
Table 3: Distribution of 56 Class I A and B alleles in supertypes
|
Supertype |
Count |
|
A01 |
6 |
|
A02 |
3 |
|
A03 |
6 |
|
A24 |
3 |
|
A103 |
1 |
|
A124 |
1 |
|
B07 |
8 |
|
B08 |
1 |
|
B27 |
8 |
|
B44 |
11 |
|
B58 |
3 |
|
B62 |
2 |
|
Unassigned |
3 |
|
Total |
56 |
Table 4: The 127 HLA alleles used and their Class, gene and supertype assignments.
|
Index |
Allele |
Class |
Gene |
Supertype |
|
1 |
A*01:01 |
I |
A |
A01 |
|
2 |
A*02:01 |
I |
A |
A02 |
|
3 |
A*02:05 |
I |
A |
A02 |
|
4 |
A*03:01 |
I |
A |
A03 |
|
5 |
A*11:01 |
I |
A |
A03 |
|
6 |
A*23:01 |
I |
A |
A24 |
|
7 |
A*24:02 |
I |
A |
A24 |
|
8 |
A*25:01 |
I |
A |
A01 |
|
9 |
A*26:01 |
I |
A |
A01 |
|
10 |
A*29:01 |
I |
A |
A24 |
|
11 |
A*29:02 |
I |
A |
A01 A24 |
|
12 |
A*30:01 |
I |
A |
A01 A03 |
|
13 |
A*30:02 |
I |
A |
A01 |
|
14 |
A*31:01 |
I |
A |
A03 |
|
15 |
A*32:01 |
I |
A |
A01 |
|
16 |
A*33:01 |
I |
A |
A03 |
|
17 |
A*33:03 |
I |
A |
A03 |
|
18 |
A*36:01 |
I |
A |
A01 |
|
19 |
A*68:01 |
I |
A |
A03 |
|
20 |
A*68:02 |
I |
A |
A02 |
|
21 |
B*07:02 |
I |
B |
B07 |
|
22 |
B*08:01 |
I |
B |
B08 |
|
23 |
B*13:02 |
I |
B |
Unassigned |
|
24 |
B*14:01 |
I |
B |
B27 |
|
25 |
B*14:02 |
I |
B |
B27 |
|
26 |
B*15:01 |
I |
B |
B62 |
|
27 |
B*15:17 |
I |
B |
B58 |
|
28 |
B*15:18 |
I |
B |
B27 |
|
29 |
B*18:01 |
I |
B |
B44 |
|
30 |
B*27:02 |
I |
B |
B27 |
|
31 |
B*27:05 |
I |
B |
B27 |
|
32 |
B*35:01 |
I |
B |
B07 |
|
33 |
B*35:02 |
I |
B |
B07 |
|
34 |
B*35:03 |
I |
B |
B07 |
|
35 |
B*35:08 |
I |
B |
B07 |
|
36 |
B*37:01 |
I |
B |
B44 |
|
37 |
B*38:01 |
I |
B |
B27 |
|
38 |
B*39:01 |
I |
B |
B27 |
|
39 |
B*39:06 |
I |
B |
B27 |
|
40 |
B*40:01 |
I |
B |
B44 |
|
41 |
B*40:02 |
I |
B |
B44 |
|
42 |
B*41:01 |
I |
B |
B44 |
|
43 |
B*41:02 |
I |
B |
B44 |
|
44 |
B*44:02 |
I |
B |
B44 |
|
45 |
B*44:03 |
I |
B |
B44 |
|
46 |
B*44:05 |
I |
B |
B44 |
|
47 |
B*45:01 |
I |
B |
B44 |
|
48 |
B*47:01 |
I |
B |
Unassigned |
|
49 |
B*49:01 |
I |
B |
Unassigned |
|
50 |
B*50:01 |
I |
B |
B44 |
|
51 |
B*51:01 |
I |
B |
B07 |
|
52 |
B*52:01 |
I |
B |
B62 |
|
53 |
B*55:01 |
I |
B |
B07 |
|
54 |
B*56:01 |
I |
B |
B07 |
|
55 |
B*57:01 |
I |
B |
B58 |
|
56 |
B*58:01 |
I |
B |
B58 |
|
57 |
C*01:02 |
I |
C |
|
|
58 |
C*03:03 |
I |
C |
|
|
59 |
C*04:01 |
I |
C |
|
|
60 |
C*05:01 |
I |
C |
|
|
61 |
C*06:02 |
I |
C |
|
|
62 |
C*07:01 |
I |
C |
|
|
63 |
C*07:02 |
I |
C |
|
|
64 |
C*07:04 |
I |
C |
|
|
65 |
C*12:02 |
I |
C |
|
|
66 |
C*12:03 |
I |
C |
|
|
67 |
C*14:02 |
I |
C |
|
|
68 |
C*15:02 |
I |
C |
|
|
69 |
C*16:01 |
I |
C |
|
|
70 |
DPB1*01:01 |
II |
DPB1 |
|
|
71 |
DPB1*02:01 |
II |
DPB1 |
|
|
72 |
DPB1*02:02 |
II |
DPB1 |
|
|
73 |
DPB1*03:01 |
II |
DPB1 |
|
|
74 |
DPB1*04:01 |
II |
DPB1 |
|
|
75 |
DPB1*04:02 |
II |
DPB1 |
|
|
76 |
DPB1*05:01 |
II |
DPB1 |
|
|
77 |
DPB1*06:01 |
II |
DPB1 |
|
|
78 |
DPB1*09:01 |
II |
DPB1 |
|
|
79 |
DPB1*10:01 |
II |
DPB1 |
|
|
80 |
DPB1*11:01 |
II |
DPB1 |
|
|
81 |
DPB1*13:01 |
II |
DPB1 |
|
|
82 |
DPB1*14:01 |
II |
DPB1 |
|
|
83 |
DPB1*17:01 |
II |
DPB1 |
|
|
84 |
DPB1*19:01 |
II |
DPB1 |
|
|
85 |
DQB1*02:01 |
II |
DQB1 |
|
|
86 |
DQB1*02:02 |
II |
DQB1 |
|
|
87 |
DQB1*03:01 |
II |
DQB1 |
|
|
88 |
DQB1*03:02 |
II |
DQB1 |
|
|
89 |
DQB1*03:03 |
II |
DQB1 |
|
|
90 |
DQB1*04:02 |
II |
DQB1 |
|
|
91 |
DQB1*05:01 |
II |
DQB1 |
|
|
92 |
DQB1*05:02 |
II |
DQB1 |
|
|
93 |
DQB1*05:03 |
II |
DQB1 |
|
|
94 |
DQB1*06:01 |
II |
DQB1 |
|
|
95 |
DQB1*06:02 |
II |
DQB1 |
|
|
96 |
DQB1*06:03 |
II |
DQB1 |
|
|
97 |
DQB1*06:04 |
II |
DQB1 |
|
|
98 |
DQB1*06:09 |
II |
DQB1 |
|
|
99 |
DRB1*01:01 |
II |
DRB1 |
|
|
100 |
DRB1*01:02 |
II |
DRB1 |
|
|
101 |
DRB1*01:03 |
II |
DRB1 |
|
|
102 |
DRB1*03:01 |
II |
DRB1 |
|
|
103 |
DRB1*04:01 |
II |
DRB1 |
|
|
104 |
DRB1*04:02 |
II |
DRB1 |
|
|
105 |
DRB1*04:03 |
II |
DRB1 |
|
|
106 |
DRB1*04:04 |
II |
DRB1 |
|
|
107 |
DRB1*04:05 |
II |
DRB1 |
|
|
108 |
DRB1*04:07 |
II |
DRB1 |
|
|
109 |
DRB1*04:08 |
II |
DRB1 |
|
|
110 |
DRB1*07:01 |
II |
DRB1 |
|
|
111 |
DRB1*08:01 |
II |
DRB1 |
|
|
112 |
DRB1*08:03 |
II |
DRB1 |
|
|
113 |
DRB1*09:01 |
II |
DRB1 |
|
|
114 |
DRB1*10:01 |
II |
DRB1 |
|
|
115 |
DRB1*11:01 |
II |
DRB1 |
|
|
116 |
DRB1*11:02 |
II |
DRB1 |
|
|
117 |
DRB1*11:03 |
II |
DRB1 |
|
|
118 |
DRB1*11:04 |
II |
DRB1 |
|
|
119 |
DRB1*12:01 |
II |
DRB1 |
|
|
120 |
DRB1*13:01 |
II |
DRB1 |
|
|
121 |
DRB1*13:02 |
II |
DRB1 |
|
|
122 |
DRB1*13:03 |
II |
DRB1 |
|
|
123 |
DRB1*13:05 |
II |
DRB1 |
|
|
124 |
DRB1*14:01 |
II |
DRB1 |
|
|
125 |
DRB1*15:01 |
II |
DRB1 |
|
|
126 |
DRB1*15:02 |
II |
DRB1 |
|
|
127 |
DRB1*16:01 |
II |
DRB1 |
Data analysis
HLA profiles for each cancer were derived by computing, first, the Pearson correlation coefficient, , between the prevalence of a cancer and the population frequency of an allele, and then Fisher z-transform it, , to normalize its distribution:
HLA-cancer Protection/Susceptibility (P/S) estimate (1)
Negative P/S estimates indicate a protective association (“protective” alleles), whereas positive P/S estimates indicate a susceptibility association (“susceptibility” alleles). Thus 30 Cancer-HLA profiles were computed, each consisting of 127 values of . These data were tabulated in a 127 allele (rows) x 30 cancers (columns) matrix (“Cancer-HLA” matrix). We then derived estimates of HLA-Cancer protection and susceptibility by transforming the values of into binary values, by assigning the values of 1 and zero to negative (protective) and positive (susceptibility) values, respectively. Therefore, each row (Allele) comprised 30 such binary values (one per Cancer), and each column (Cancer) comprised 127 binary values (one per allele). From these data, we derived the following estimates of HLA-Cancer associations: (a) the proportion of alleles protective for a cancer (Protective Proportion, PP), (b) its 95% Confidence Intervals (CI), and (c) the upper-to-lower Confidence Limit Ratio (CLR)17:

The PP provided an overall estimate, from the current sample, of the HLA-Cancer association but its assessment in the context of HLA-Cancer protection rests with the values of its 95% CI and corresponding CLR. More specifically, the values of 95% CI demarcate the range within which the “true” PP in a large sample (the population) would be found 95% of times (in repeated measurements)14,16,18. Finally, the upper-to-lower CLR assesses the stability of the PP estimate, with lower CLR indicating a more stable estimate. Since this study is not about testing an overarching hypothesis, we did not report P-values nor refer to significance testing. Instead, we applied the 0.5 cutoff point to the estimate of PP and its 95% CI to assign a specific HLA-Cancer effect to one of 3 groups: (a) “Mostly Protective”, if PP > 0.5 and its lower 95% CI > 0.5; (b) “Mostly Susceptibility”, if PP < 0.5 and its upper 95% CI < 0.5; and (c) “Mixed”, if lower 95% CI < 0.5 and upper 95% CI > 0.5, where the PP estimate can take any value from 0 to 1. Since the focus of this study was the overall assessment of HLA-Cancer relations, no analyses of HLA relations to individual cancer types were performed. The Wilson score26 was used to derive the asymptotic standard error and 95% CI. Statistical analyses were performed using the IBM−SPSS package (IBM SPSS Statistics for Windows, Version 27.0, 64−bit edition. Armonk, NY: IBM Corp; 2019) and Intel FORTRAN (Microsoft Visual Studio Community 2019, Version 16.7.5; Intel FORTRAN Compiler 2021).
Results
The immunogenetic protective and susceptibility influence of four HLA alleles on various types of cancer are illustrated in Fig. 1A, B and Fig. 1C,D, respectively.
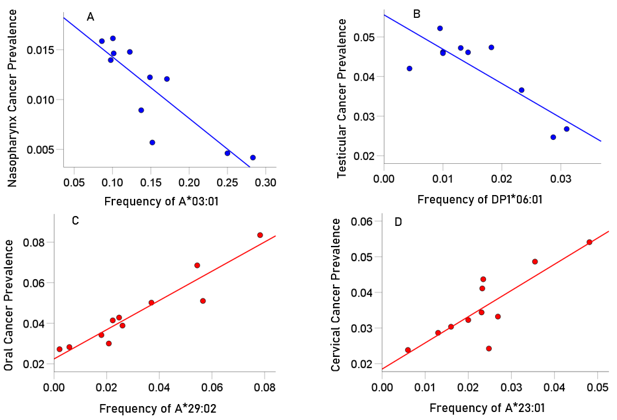
Figure 1: Examples of two HLA cancer protective alleles illustrating the negative influence of HLA allele frequency on cancer prevalence.
A, the prevalence (%) of cancer of nasopharynx in 11 CWE countries is plotted against the frequency of A*03:01: r = −0.862, r' = −1.301, P = 0.001.
B, the prevalence of testicular cancer in 9 CWE countries is plotted against the frequency of DPB1*06:02: r = −0.832, r' = −1.195, P = 0.003. C and D: Examples of two HLA cancer susceptibility alleles illustrating the positive influence of HLA allele frequency on cancer prevalence.
C, the prevalence (%) of oral cancer in 11 CWE countries is plotted against the frequency of A*29:02: r = 0.949, r' = 1.822, P < 0.001.
D, the prevalence of cervical cancer in 11 CWE countries is plotted against the frequency of A*23:01: r = 0.834, r' = 1.201, P = 0.001.
Effects of individual alleles on cancer
The effect of individual alleles on cancer are given in Table 5. The basic finding is that all alleles had both protective and susceptibility effects on various cancers. Most of the alleles (99/127 = 78%) were in the “Mixed” group, whereas 20/127 (16%) and 8/127 (6%) were in the “Mostly Protective” and “Mostly Susceptibility” groups. The PP estimates were relatively stable; the mean ± SEM of CLR was 2.021 ± 0.039 (range 1.35 – 3.47).
Table 5: Proportion protective and associated statistics for the 127 individual alleles tested. Blue: Protective; Red: Susceptibility; Black: Mixed.
|
Index |
Allele |
N protective (out of 30 cancers total) |
Proportion protective |
Asymptotic standard error |
Lower 95% CI |
Upper 95% CI |
Confidence Limit Ratio |
|
1 |
A*01:01 |
19 |
0.633 |
0.088 |
0.455 |
0.781 |
1.716 |
|
2 |
A*02:01 |
13 |
0.433 |
0.09 |
0.274 |
0.608 |
2.219 |
|
3 |
A*02:05 |
12 |
0.4 |
0.089 |
0.246 |
0.577 |
2.346 |
|
4 |
A*03:01 |
18 |
0.6 |
0.089 |
0.423 |
0.754 |
1.783 |
|
5 |
A*11:01 |
12 |
0.4 |
0.089 |
0.246 |
0.577 |
2.346 |
|
6 |
A*23:01 |
16 |
0.533 |
0.091 |
0.361 |
0.698 |
1.934 |
|
7 |
A*24:02 |
20 |
0.667 |
0.086 |
0.488 |
0.808 |
1.656 |
|
8 |
A*25:01 |
9 |
0.3 |
0.084 |
0.167 |
0.479 |
2.868 |
|
9 |
A*26:01 |
17 |
0.567 |
0.09 |
0.392 |
0.726 |
1.852 |
|
10 |
A*29:01 |
21 |
0.7 |
0.084 |
0.521 |
0.833 |
1.599 |
|
11 |
A*29:02 |
11 |
0.367 |
0.088 |
0.219 |
0.545 |
2.489 |
|
12 |
A*30:01 |
12 |
0.4 |
0.089 |
0.246 |
0.577 |
2.346 |
|
13 |
A*30:02 |
10 |
0.333 |
0.086 |
0.192 |
0.512 |
2.667 |
|
14 |
A*31:01 |
21 |
0.7 |
0.084 |
0.521 |
0.833 |
1.599 |
|
15 |
A*32:01 |
18 |
0.6 |
0.089 |
0.423 |
0.754 |
1.783 |
|
16 |
A*33:01 |
14 |
0.467 |
0.091 |
0.302 |
0.639 |
2.116 |
|
17 |
A*33:03 |
24 |
0.8 |
0.073 |
0.627 |
0.905 |
1.443 |
|
18 |
A*36:01 |
16 |
0.533 |
0.091 |
0.361 |
0.698 |
1.934 |
|
19 |
A*68:01 |
19 |
0.633 |
0.088 |
0.455 |
0.781 |
1.716 |
|
20 |
A*68:02 |
22 |
0.733 |
0.081 |
0.556 |
0.858 |
1.543 |
|
21 |
B*07:02 |
21 |
0.7 |
0.084 |
0.521 |
0.833 |
1.599 |
|
22 |
B*08:01 |
15 |
0.5 |
0.091 |
0.332 |
0.668 |
2.012 |
|
23 |
B*13:02 |
16 |
0.533 |
0.091 |
0.361 |
0.698 |
1.934 |
|
24 |
B*14:01 |
14 |
0.467 |
0.091 |
0.302 |
0.639 |
2.116 |
|
25 |
B*14:02 |
13 |
0.433 |
0.09 |
0.274 |
0.608 |
2.219 |
|
26 |
B*15:01 |
18 |
0.6 |
0.089 |
0.423 |
0.754 |
1.783 |
|
27 |
B*15:17 |
10 |
0.333 |
0.086 |
0.192 |
0.512 |
2.667 |
|
28 |
B*15:18 |
18 |
0.6 |
0.089 |
0.423 |
0.754 |
1.783 |
|
29 |
B*18:01 |
14 |
0.467 |
0.091 |
0.302 |
0.639 |
2.116 |
|
30 |
B*27:02 |
19 |
0.633 |
0.088 |
0.455 |
0.781 |
1.716 |
|
31 |
B*27:05 |
24 |
0.8 |
0.073 |
0.627 |
0.905 |
1.443 |
|
32 |
B*35:01 |
14 |
0.467 |
0.091 |
0.302 |
0.639 |
2.116 |
|
33 |
B*35:02 |
21 |
0.7 |
0.084 |
0.521 |
0.833 |
1.599 |
|
34 |
B*35:03 |
10 |
0.333 |
0.086 |
0.192 |
0.512 |
2.667 |
|
35 |
B*35:08 |
16 |
0.533 |
0.091 |
0.361 |
0.698 |
1.934 |
|
36 |
B*37:01 |
18 |
0.6 |
0.089 |
0.423 |
0.754 |
1.783 |
|
37 |
B*38:01 |
17 |
0.567 |
0.09 |
0.392 |
0.726 |
1.852 |
|
38 |
B*39:01 |
18 |
0.6 |
0.089 |
0.423 |
0.754 |
1.783 |
|
39 |
B*39:06 |
21 |
0.7 |
0.084 |
0.521 |
0.833 |
1.599 |
|
40 |
B*40:01 |
19 |
0.633 |
0.088 |
0.455 |
0.781 |
1.716 |
|
41 |
B*40:02 |
26 |
0.867 |
0.062 |
0.703 |
0.947 |
1.347 |
|
42 |
B*41:01 |
15 |
0.5 |
0.091 |
0.332 |
0.668 |
2.012 |
|
43 |
B*41:02 |
18 |
0.6 |
0.089 |
0.423 |
0.754 |
1.783 |
|
44 |
B*44:02 |
19 |
0.633 |
0.088 |
0.455 |
0.781 |
1.716 |
|
45 |
B*44:03 |
13 |
0.433 |
0.09 |
0.274 |
0.608 |
2.219 |
|
46 |
B*44:05 |
18 |
0.6 |
0.089 |
0.423 |
0.754 |
1.783 |
|
47 |
B*45:01 |
17 |
0.567 |
0.09 |
0.392 |
0.726 |
1.852 |
|
48 |
B*47:01 |
20 |
0.667 |
0.086 |
0.488 |
0.808 |
1.656 |
|
49 |
B*49:01 |
14 |
0.467 |
0.091 |
0.302 |
0.639 |
2.116 |
|
50 |
B*50:01 |
17 |
0.567 |
0.09 |
0.392 |
0.726 |
1.852 |
|
51 |
B*51:01 |
18 |
0.6 |
0.089 |
0.423 |
0.754 |
1.783 |
|
52 |
B*52:01 |
20 |
0.667 |
0.086 |
0.488 |
0.808 |
1.656 |
|
53 |
B*55:01 |
7 |
0.233 |
0.077 |
0.118 |
0.409 |
3.466 |
|
54 |
B*56:01 |
17 |
0.567 |
0.09 |
0.392 |
0.726 |
1.852 |
|
55 |
B*57:01 |
14 |
0.467 |
0.091 |
0.302 |
0.639 |
2.116 |
|
56 |
B*58:01 |
15 |
0.5 |
0.091 |
0.332 |
0.668 |
2.012 |
|
57 |
C*01:02 |
17 |
0.567 |
0.09 |
0.392 |
0.726 |
1.852 |
|
58 |
C*03:03 |
15 |
0.5 |
0.091 |
0.332 |
0.668 |
2.012 |
|
59 |
C*04:01 |
17 |
0.567 |
0.09 |
0.392 |
0.726 |
1.852 |
|
60 |
C*05:01 |
15 |
0.5 |
0.091 |
0.332 |
0.668 |
2.012 |
|
61 |
C*06:02 |
10 |
0.333 |
0.086 |
0.192 |
0.512 |
2.667 |
|
62 |
C*07:01 |
16 |
0.533 |
0.091 |
0.361 |
0.698 |
1.934 |
|
63 |
C*07:02 |
13 |
0.433 |
0.09 |
0.274 |
0.608 |
2.219 |
|
64 |
C*07:04 |
20 |
0.667 |
0.086 |
0.488 |
0.808 |
1.656 |
|
65 |
C*12:02 |
16 |
0.533 |
0.091 |
0.361 |
0.698 |
1.934 |
|
66 |
C*12:03 |
13 |
0.433 |
0.09 |
0.274 |
0.608 |
2.219 |
|
67 |
C*14:02 |
18 |
0.6 |
0.089 |
0.423 |
0.754 |
1.783 |
|
68 |
C*15:02 |
18 |
0.6 |
0.089 |
0.423 |
0.754 |
1.783 |
|
69 |
C*16:01 |
12 |
0.4 |
0.089 |
0.246 |
0.577 |
2.346 |
|
70 |
DPB1*01:01 |
16 |
0.533 |
0.091 |
0.361 |
0.698 |
1.934 |
|
71 |
DPB1*02:01 |
12 |
0.4 |
0.089 |
0.246 |
0.577 |
2.346 |
|
72 |
DPB1*02:02 |
16 |
0.533 |
0.091 |
0.361 |
0.698 |
1.934 |
|
73 |
DPB1*03:01 |
7 |
0.233 |
0.077 |
0.118 |
0.409 |
3.466 |
|
74 |
DPB1*04:01 |
22 |
0.733 |
0.081 |
0.556 |
0.858 |
1.543 |
|
75 |
DPB1*04:02 |
24 |
0.8 |
0.073 |
0.627 |
0.905 |
1.443 |
|
76 |
DPB1*05:01 |
16 |
0.533 |
0.091 |
0.361 |
0.698 |
1.934 |
|
77 |
DPB1*06:01 |
19 |
0.633 |
0.088 |
0.455 |
0.781 |
1.716 |
|
78 |
DPB1*09:01 |
9 |
0.3 |
0.084 |
0.167 |
0.479 |
2.868 |
|
79 |
DPB1*10:01 |
13 |
0.433 |
0.09 |
0.274 |
0.608 |
2.219 |
|
80 |
DPB1*11:01 |
10 |
0.333 |
0.086 |
0.192 |
0.512 |
2.667 |
|
81 |
DPB1*13:01 |
15 |
0.5 |
0.091 |
0.332 |
0.668 |
2.012 |
|
82 |
DPB1*14:01 |
17 |
0.567 |
0.09 |
0.392 |
0.726 |
1.852 |
|
83 |
DPB1*17:01 |
12 |
0.4 |
0.089 |
0.246 |
0.577 |
2.346 |
|
84 |
DPB1*19:01 |
14 |
0.467 |
0.091 |
0.302 |
0.639 |
2.116 |
|
85 |
DQB1*02:01 |
12 |
0.4 |
0.089 |
0.246 |
0.577 |
2.346 |
|
86 |
DQB1*02:02 |
14 |
0.467 |
0.091 |
0.302 |
0.639 |
2.116 |
|
87 |
DQB1*03:01 |
10 |
0.333 |
0.086 |
0.192 |
0.512 |
2.667 |
|
88 |
DQB1*03:02 |
10 |
0.333 |
0.086 |
0.192 |
0.512 |
2.667 |
|
89 |
DQB1*03:03 |
23 |
0.767 |
0.077 |
0.591 |
0.882 |
1.492 |
|
90 |
DQB1*04:02 |
24 |
0.8 |
0.073 |
0.627 |
0.905 |
1.443 |
|
91 |
DQB1*05:01 |
23 |
0.767 |
0.077 |
0.591 |
0.882 |
1.492 |
|
92 |
DQB1*05:02 |
10 |
0.333 |
0.086 |
0.192 |
0.512 |
2.667 |
|
93 |
DQB1*05:03 |
7 |
0.233 |
0.077 |
0.118 |
0.409 |
3.466 |
|
94 |
DQB1*06:01 |
22 |
0.733 |
0.081 |
0.556 |
0.858 |
1.543 |
|
95 |
DQB1*06:02 |
19 |
0.633 |
0.088 |
0.455 |
0.781 |
1.716 |
|
96 |
DQB1*06:03 |
19 |
0.633 |
0.088 |
0.455 |
0.781 |
1.716 |
|
97 |
DQB1*06:04 |
21 |
0.7 |
0.084 |
0.521 |
0.833 |
1.599 |
|
98 |
DQB1*06:09 |
16 |
0.533 |
0.091 |
0.361 |
0.698 |
1.934 |
|
99 |
DRB1*01:01 |
15 |
0.5 |
0.091 |
0.332 |
0.668 |
2.012 |
|
100 |
DRB1*01:02 |
17 |
0.567 |
0.09 |
0.392 |
0.726 |
1.852 |
|
101 |
DRB1*01:03 |
18 |
0.6 |
0.089 |
0.423 |
0.754 |
1.783 |
|
102 |
DRB1*03:01 |
9 |
0.3 |
0.084 |
0.167 |
0.479 |
2.868 |
|
103 |
DRB1*04:01 |
17 |
0.567 |
0.09 |
0.392 |
0.726 |
1.852 |
|
104 |
DRB1*04:02 |
14 |
0.467 |
0.091 |
0.302 |
0.639 |
2.116 |
|
105 |
DRB1*04:03 |
13 |
0.433 |
0.09 |
0.274 |
0.608 |
2.219 |
|
106 |
DRB1*04:04 |
21 |
0.7 |
0.084 |
0.521 |
0.833 |
1.599 |
|
107 |
DRB1*04:05 |
7 |
0.233 |
0.077 |
0.118 |
0.409 |
3.466 |
|
108 |
DRB1*04:07 |
16 |
0.533 |
0.091 |
0.361 |
0.698 |
1.934 |
|
109 |
DRB1*04:08 |
24 |
0.8 |
0.073 |
0.627 |
0.905 |
1.443 |
|
110 |
DRB1*07:01 |
14 |
0.467 |
0.091 |
0.302 |
0.639 |
2.116 |
|
111 |
DRB1*08:01 |
24 |
0.8 |
0.073 |
0.627 |
0.905 |
1.443 |
|
112 |
DRB1*08:03 |
18 |
0.6 |
0.089 |
0.423 |
0.754 |
1.783 |
|
113 |
DRB1*09:01 |
25 |
0.833 |
0.068 |
0.664 |
0.927 |
1.396 |
|
114 |
DRB1*10:01 |
19 |
0.633 |
0.088 |
0.455 |
0.781 |
1.716 |
|
115 |
DRB1*11:01 |
10 |
0.333 |
0.086 |
0.192 |
0.512 |
2.667 |
|
116 |
DRB1*11:02 |
16 |
0.533 |
0.091 |
0.361 |
0.698 |
1.934 |
|
117 |
DRB1*11:03 |
9 |
0.3 |
0.084 |
0.167 |
0.479 |
2.868 |
|
118 |
DRB1*11:04 |
10 |
0.333 |
0.086 |
0.192 |
0.512 |
2.667 |
|
119 |
DRB1*12:01 |
14 |
0.467 |
0.091 |
0.302 |
0.639 |
2.116 |
|
120 |
DRB1*13:01 |
15 |
0.5 |
0.091 |
0.332 |
0.668 |
2.012 |
|
121 |
DRB1*13:02 |
14 |
0.467 |
0.091 |
0.302 |
0.639 |
2.116 |
|
122 |
DRB1*13:03 |
16 |
0.533 |
0.091 |
0.361 |
0.698 |
1.934 |
|
123 |
DRB1*13:05 |
19 |
0.633 |
0.088 |
0.455 |
0.781 |
1.716 |
|
124 |
DRB1*14:01 |
12 |
0.4 |
0.089 |
0.246 |
0.577 |
2.346 |
|
125 |
DRB1*15:01 |
16 |
0.533 |
0.091 |
0.361 |
0.698 |
1.934 |
|
126 |
DRB1*15:02 |
20 |
0.667 |
0.086 |
0.488 |
0.808 |
1.656 |
|
127 |
DRB1*16:01 |
16 |
0.533 |
0.091 |
0.361 |
0.698 |
1.934 |
Overall effects of HLA on cancer, including effects of Class and Genes (Table 6)
There was an overall protective effect of HLA on cancer, and similarly for HLA Class I in general and for HLA Class I genes A and B, in particular; all of these groups had “mostly Protective mostly” effects. The remainder (HLA Class II and genes DPB1, DQB1 and DRB1) had “Mixed effects”. However, the highest PP estimate was 0.559, which means that at least 40% of the alleles in those groups had a susceptibility effect, although the overall bias was towards a protective effect. As shown in the CLR column of Table 6, the PP estimates were stable, with all CLR values < 2, and all but one < 1.5.
Table 6 :Proportion Protective and associated statistics: Overall, HLA Class I and II, and their genes. N total is the number of alleles in the group specified x 30 cancers. Blue: Protective; Black: Mixed.
|
|
N protective |
N total |
Proportion protective |
Asymptotic standard error |
95% Confidence Interval |
Confidence Limit Ratio |
|
|
Lower |
Upper |
||||||
|
Overall |
2038 |
3810 |
0.535 |
0.008 |
0.519 |
0.551 |
1.062 |
|
Class I |
1128 |
2070 |
0.545 |
0.011 |
0.523 |
0.566 |
1.082 |
|
A |
324 |
600 |
0.540 |
0.02 |
0.500 |
0.579 |
1.158 |
|
B |
604 |
1080 |
0.559 |
0.015 |
0.529 |
0.589 |
1.113 |
|
C |
200 |
390 |
0.513 |
0.025 |
0.463 |
0.562 |
1.214 |
|
Class II |
910 |
1740 |
0.523 |
0.012 |
0.499 |
0.546 |
1.033 |
|
DPB1 |
222 |
450 |
0.493 |
0.024 |
0.447 |
0.539 |
1.206 |
|
DQB1 |
230 |
420 |
0.548 |
0.024 |
0.500 |
0.595 |
1.190 |
|
DRB1 |
458 |
870 |
0.526 |
0.017 |
0.493 |
0.559 |
1.134 |
Effects of A and B supertypes on cancer
Of 12 supertypes tested, supertypes A03, A24, B27, B44 and B52 had a statistically significant protective effect both in the test of proportions (Table 7). However, the highest PP estimate was 0.633, which means that at least 35% of the alleles in any supertype had a susceptibility effect on cancer. This can be evaluated by looking up in Table 5 the effects of individual alleles assigned to a specific supertype. Finally, the CLR values ranged from 1.199 to 2.489.
Table 7: Proportion protective and associated statistics for HLA Class I genes A and B supertypes. N total is number of alleles in a supertype (Table 3) x 30 cancers. Blue: Protective; Black: Mixed.
| Supertype |
N protective |
N total |
Proportion protective |
Asymptotic standard error |
95% Confidence Interval |
Confidence Limit Ratio |
|
|
Lower |
Upper |
||||||
|
A01 |
89 |
180 |
0.494 |
0.037 |
0.422 |
0.567 |
1.344 |
|
A02 |
47 |
90 |
0.522 |
0.053 |
0.420 |
0.622 |
1.481 |
|
A03 |
108 |
180 |
0.600 |
0.037 |
0.527 |
0.669 |
1.269 |
|
A24 |
57 |
90 |
0.633 |
0.051 |
0.530 |
0.726 |
1.370 |
|
A01 A03 |
12 |
30 |
0.400 |
0.089 |
0.246 |
0.577 |
2.346 |
|
A01 A24 |
11 |
30 |
0.367 |
0.088 |
0.219 |
0.545 |
2.489 |
|
B07 |
124 |
240 |
0.517 |
0.032 |
0.454 |
0.579 |
1.275 |
|
B08 |
15 |
30 |
0.500 |
0.091 |
0.332 |
0.668 |
2.012 |
|
B27 |
144 |
240 |
0.600 |
0.032 |
0.537 |
0.660 |
1.229 |
|
B44 |
194 |
330 |
0.588 |
0.027 |
0.534 |
0.640 |
1.199 |
|
B58 |
39 |
90 |
0.433 |
0.052 |
0.336 |
0.536 |
1.595 |
|
B62 |
38 |
60 |
0.633 |
0.062 |
0.507 |
0.744 |
1.467 |
Effects on specific cancer types
The overall effects of HLA on specific cancer types are shown in Table 8. It can be seen that “Mostly Protective” effects predominated, so that cancers with such effects (N = 13) outnumbered cancers with “Mostly Susceptibility” effects (N =2) by more than 6 times.
Table 8: Proportion protective and associated statistics for one-sample proportions for the 30 cancers studied. Blue: Protective; Red: Susceptibility; Black: Mixed.
|
Index |
Cancer |
N protective (Out of 127 alleles total) |
Proportion protective |
Asymptotic standard error |
Lower 95% CI |
Upper 95% CI |
CLR |
|
1 |
Bladder |
55 |
0.433 |
0.044 |
0.35 |
0.52 |
1.486 |
|
2 |
Brain |
62 |
0.488 |
0.044 |
0.403 |
0.574 |
1.424 |
|
3 |
Breast |
83 |
0.654 |
0.042 |
0.567 |
0.731 |
1.289 |
|
4 |
Cervical |
51 |
0.402 |
0.043 |
0.320 |
0.489 |
1.528 |
|
5 |
Colorectal |
69 |
0.543 |
0.044 |
0.457 |
0.627 |
1.372 |
|
6 |
Esophageal |
79 |
0.622 |
0.043 |
0.535 |
0.702 |
1.312 |
|
7 |
Gallbladder |
66 |
0.52 |
0.044 |
0.433 |
0.605 |
1.397 |
|
8 |
Hodgkin |
63 |
0.496 |
0.044 |
0.411 |
0.582 |
1.416 |
|
9 |
Kidney |
78 |
0.614 |
0.043 |
0.527 |
0.694 |
1.317 |
|
10 |
Larynx |
54 |
0.425 |
0.044 |
0.343 |
0.512 |
1.493 |
|
11 |
Oral |
79 |
0.622 |
0.043 |
0.535 |
0.702 |
1.312 |
|
12 |
Liver |
60 |
0.472 |
0.044 |
0.388 |
0.559 |
1.441 |
|
13 |
Malignant melanoma |
79 |
0.622 |
0.043 |
0.535 |
0.702 |
1.312 |
|
14 |
Mesothelioma |
77 |
0.606 |
0.043 |
0.519 |
0.687 |
1.324 |
|
15 |
Multiple myeloma |
74 |
0.583 |
0.044 |
0.496 |
0.665 |
1.341 |
|
16 |
Nasopharynx |
49 |
0.386 |
0.043 |
0.306 |
0.473 |
1.546 |
|
17 |
Neoplasms |
78 |
0.614 |
0.043 |
0.527 |
0.694 |
1.317 |
|
18 |
Non Hodgkin |
75 |
0.591 |
0.044 |
0.504 |
0.672 |
1.333 |
|
19 |
Non melanoma skin |
56 |
0.441 |
0.044 |
0.358 |
0.528 |
1.475 |
|
20 |
Non melanoma basal cell |
55 |
0.433 |
0.044 |
0.350 |
0.520 |
1.486 |
|
21 |
Non melanoma squamous cell |
59 |
0.465 |
0.044 |
0.380 |
0.551 |
1.450 |
|
22 |
Other Pharynx |
80 |
0.63 |
0.043 |
0.543 |
0.709 |
1.306 |
|
23 |
Ovarian |
75 |
0.591 |
0.044 |
0.504 |
0.672 |
1.333 |
|
24 |
Pancreatic |
75 |
0.591 |
0.044 |
0.504 |
0.672 |
1.333 |
|
25 |
Prostate |
76 |
0.598 |
0.043 |
0.511 |
0.680 |
1.331 |
|
26 |
Stomach |
58 |
0.457 |
0.044 |
0.373 |
0.543 |
1.456 |
|
27 |
Testicular |
75 |
0.591 |
0.044 |
0.504 |
0.672 |
1.333 |
|
28 |
Thyroid |
71 |
0.559 |
0.044 |
0.472 |
0.642 |
1.360 |
|
29 |
Tracheal, bronchus, lung |
67 |
0.528 |
0.044 |
0.441 |
0.612 |
1.388 |
|
30 |
Uterine |
60 |
0.472 |
0.044 |
0.388 |
0.559 |
1.441 |
Discussion
Here we used a population immunogenetic approach to evaluate the association of 127 HLA alleles with 30 cancers in 14 Continental Western European countries. The findings document a preponderance of protective effects of HLA on cancer in general and on specific cancers in particular. Every allele exerted both protective and susceptibility effects for various types of cancer. However, the strength of these effects varied across individual alleles, groups of alleles (HLA Class I and II, genes and supertypes), and across cancer types. We qualified this strength by relying on the 95% confidence intervals of the effect estimate and were thus able to grade the effect as “Mostly Protective”, “Mostly Susceptibility”, and “Mixed”. We found Mostly Protective effects overall and in HLA Class I A and B. Analyses examining the effects of individual alleles on cancer documented particularly robust protective effects for HLA-B*40:02, but also protective effects conferred by several other Class I and Class II alleles (Table 5). The protective effects of B*40:02 observed here are consistent with a previous finding of beneficial effects of B*40:02 with regard to melanoma treatment outcomes5. Those effects were attributed to amino acid composition in the binding pocket that enhances binding affinity and facilitates immune presentation of neoantigens5. The present findings suggest that B*40:02 likely has enhanced capability of binding epitopes from a number of different cancers.
Although fewer in number than protective HLA, several alleles were associated with broad susceptibility to cancer. Specifically, Class I HLA-B*55:01 and three HLA Class II alleles – DPB1*03:01, DQB1*05:03, DRB1*04:05 were associated with significantly fewer protective effects and, accordingly, a higher proportion of susceptibility effects. At least one of these alleles (DPB1*03:01) has previously been associated with cervical cancer risk27 and hepatocellular carcinoma28. In the case of HLA susceptibility to cancer, here too, structural features of the peptide binding groove purportedly impairing the strength of the interaction with the T cell receptor and hindering neoantigen binding have been implicated5. It is possible that structural features of these 4 alleles may inhibit binding of several different types of cancer epitopes although the mechanism underlying reduced cancer protection associated with those particularly alleles remain to be investigated. Finally, although the relative proportion of these 4 alleles indicate significantly less protection, each was protective against 7 of the 30 cancers indicating some, albeit less, protection against cancers than other alleles.
Overall, Class II HLA was not significantly associated with cancer protection although several specific Class II alleles were. For example, we found that DRB1*09:01 was protective against 25 of 30 cancers. Previous studies have documented decreased risk of cervical cancer in DRB1*09:01 carriers29. Our findings suggest that protective effects of DRB1*09:01 extend well beyond cervical cancer.
In line with the evolutionary role of HLA in host protection, the overall effects of HLA on specific cancer types demonstrated that of the 30 cancers studied, 13 were associated with predominantly protective HLA effects with regard to population prevalence. Breast cancer, in particular, was associated with the greatest proportion of protective HLA effects. In contrast, only nasopharynx and cervical cancer were associated with a statistically significant proportion of HLA alleles that favor susceptibility. Nasopharynx cancer is relatively rare, accounting for only 0.8% of cancers1. Cervical cancer, however, is one of the most common types of cancer in women1. Findings from the current study suggest that the high prevalence of cervical cancer may be partially associated with the preponderance of HLA-cervical cancer associations favoring susceptibility, presumably due to a relative inability of those alleles to effectively bind and eliminate human papillomavirus (HPV). Indeed, HLA genes have been shown to be important moderators of the persistence of HPV infection and disease progression30.
Analyses regarding HLA supertype associations with cancer merit comment. Supertypes reflect groups of HLA alleles with similar structural features in the binding groove25. The present analyses revealed overall protective effects of 5 HLA supertypes; however, we also found that alleles within a supertype exhibited different associations with cancer. For example, the B*44 supertype includes 11 alleles, of which 10 had Mixed effects and only one was Mostly Protective for cancer. Therefore, analyses aimed at HLA-disease associations need to rely on the association of specific HLA alleles with a given disease in order to avoid misleading conclusions based on HLA supertype association with disease.
The findings of the present study characterize HLA-cancer associations at the population level and highlight the complexity of associations between HLA and cancers. It should be noted that the present study focused exclusively on HLA-cancer associations in Continental Western Europe and may not generalize to other populations where HLA and cancer frequencies vary. Finally, the HLA-cancer associations documented here reflect overall cancer/risk protection conferred by HLA. HLA relations to individual cancer types were not evaluated; however, analyses aimed at determining the HLA protection/susceptibility profile for individual cancers are underway.
Acknowledgements
We dedicate this paper to the memory of Dr. Angeliki ‘Lily’ Georgopoulos, a sparkling medical scientist and compassionate physician. Partial funding for this study was provided by the University of Minnesota (the Anita Kunin Chair in Women's Healthy Brain Aging, the Brain and Genomics Fund, the McKnight Presidential Chair of Cognitive Neuroscience, and the American Legion Brain Sciences Chair) and the U.S. Department of Veterans Affairs. The sponsors had no role in the current study design, analysis or interpretation, or in the writing of this paper. The contents do not represent the views of the U.S. Department of Veterans Affairs or the United States Government.
Author contributions: A.P.G. conceived the study; L.M.J. and A.P.G. contributed to data retrieval and analysis and writing the paper.
Additional Information
Competing interests: Authors declare no competing interests.
Data and materials availability: Data are publicly available from the websites mentioned in the Materials and Methods section.
References
- Sung H, Ferlay J, Siegel RL, et al. Global Cancer Statistics 2020: GLOBOCAN Estimates of Incidence and Mortality Worldwide for 36 Cancers in 185 Countries. CA Cancer J Clin. 2021; 71(3): 209-249. doi: 10.3322/caac.21660.
- Sun M, Lemaçon A, Legault MA, et al. Genetic meta-analysis of cancer diagnosis following statin use identifies new associations and implicates human leukocyte antigen (HLA) in women. Pharmacogenomics J. 2021; 21(4): 446-457. doi: 10.1038/s41397-021-00221-z.
- Kamiza AB, Kamiza S, Mathew CG. HLA-DRB1 alleles and cervical cancer: A meta-analysis of 36 case-control studies. Cancer Epidemiol. 2020; 67: 101748. doi: 10.1016/j.canep.2020.101748.
- Sabbatino F, Liguori L, Polcaro G, et al. Role of Human Leukocyte Antigen System as A Predictive Biomarker for Checkpoint-Based Immunotherapy in Cancer Patients. Int J Mol Sci. 2020; 21(19): 7295. doi: 10.3390/ijms21197295.
- Chowell D, Morris LGT, Grigg CM, et al. Patient HLA class I genotype influences cancer response to checkpoint blockade immunotherapy. Science. 2018; 359(6375): 582-587. doi: 10.1126/science.aao4572.
- Meuer SC, Hussey RE, Hodgdon JC, et al. Surface structures involved in target recognition by human cytotoxic T lymphocytes. Science.1982; 218: 471–473. doi: 10.1126/science.6981845.
- Hov JR, Kosmoliaptsis V, Traherne JA, et al. Electrostatic modifications of the HLA-DR P9 peptide-binding pocket and susceptibility to primary sclerosing cholangitis. Hepatology. 2011; 53: 1967-1976. doi: 1002/hep.24299.
- Dendrou CA, Petersen J, Rossjohn J, et al. HLA variation and disease. Nat Rev Immunol. 2018; 18(5): 325–39. doi: 10.1038/nri.2017.143.
- James LM, Georgopoulos AP. Shared human leukocyte antigen (HLA) coverage in dementia and Parkinson’s disease. Journal of Neurology & Neuromedicine. 2020 Sep 22; 5(3). doi: 10.29245/2572.942x/2020/3.1275.
- Charonis SP, James LM, Georgopoulos AP. SARS-CoV-2 in silico binding affinity to Human Leukocyte Antigen (HLA) Class II molecules predicts vaccine effectiveness across Variants of Concern (VOC). Scientific Reports (in press).
- James LM, Georgopoulos AP. Immunogenetic clustering of 30 cancers. Scientific Reports (in press).
- Schaafsma E, Fugle CM, Wang X, et al. Pan-cancer association of HLA gene expression with cancer prognosis and immunotherapy efficacy. Br J Cancer. 2021; 125(3): 422-432. doi: 10.1038/s41416-021-01400-2.
- Rashkin SR, Graff RE, Kachuri L, et al. Pan-cancer study detects genetic risk variants and shared genetic basis in two large cohorts. Nat Commun. 2020; 11(1): 4423. doi: 10.1038/s41467-020-18246-6.
- Neyman J. Outline of a theory of statistical estimation based on the classical theory of probability. Philos Trans R Soc Lond A. 1937; 236: 333–80.
- Rothman KJ. A show of confidence. N Engl J Med. 1978; 299(24): 1362-3. doi: 10.1056/NEJM197812142992410.
- Gardner MJ, Altman DG. Confidence intervals rather than P values: estimation rather than hypothesis testing. Br Med J (Clin Res Ed). 1986; 292(6522): 746-50. doi: 10.1136/bmj.292.6522.746.
- Poole C. Low P-values or narrow confidence intervals: which are more durable? Epidemiology. 2001; 12(3): 291-4. doi: 10.1097/00001648-200105000-00005.
- Greenland S, Senn SJ, Rothman KJ, et al. Statistical tests, P values, confidence intervals, and power: a guide to misinterpretations. Eur J Epidemiol. 2016; 31(4): 337-50. doi: 10.1007/s10654-016-0149-3.
- Global Burden of Disease Collaborative Network. Global Burden of Disease Study 2016 (GBD 2016) Results. Seattle, United States: Institute for Health Metrics and Evaluation (IHME), 2020. Available from http://ghdx.healthdata.org/gbd-results-tool. Data retrieved on July 5, 2021.
- Population Reference Bureau. 2016 world population data sheet with a special focus on human needs and sustainable resources. Population Reference Bureau, Washington, DC, 2016. https://www. prb.org/2016−world−population−data−sheet/. Accessed February 5, 2019.
- James LM, Georgopoulos AP. The human leukocyte antigen (HLA) DRB1*13:02 allele protects against dementia in continental Western Europe. J Neurol Neuromed. 2019; 4(5): 1−6.
- Gonzalez-Galarza FF, McCabe A, Melo Dos Santos EJ, et al. Allele Frequency Net Database. Methods Mol Biol. 2018 ;1802: 49-62. doi: 10.1007/978-1-4939-8546-3_4.
- Allele*Frequencies in Worldwide Populations [Internet]. Allele frequency net database (AFND) 2020 update. Liverpool, UK. Available from: http://allelefrequencies.net/hla6006a.asp.
- James LM, Georgopoulos AP. Immunogenetic epidemiology of dementia and Parkinson’s Disease in 14 continental European countries: shared human leukocyte antigen (HLA) profiles. J Immunological Sci. 2021; 5(2):16−26.
- Sidney J, Peters B, Frahm N, et al. HLA class I supertypes: a revised and updated classification. BMC Immunol. 2008; 9:1. doi: 10.1186/1471-2172-9-1.
- Wilson EB. Probable inference, the law of succession, and statistical inference. J Am Stat Assoc. 1927; 22(158): 209–212. doi:10.1080/01621459.1927.10502953.
- Cheng L, Guo Y, Zhan S, et al. Association between HLA-DP Gene Polymorphisms and Cervical Cancer Risk: A Meta-Analysis. Biomed Res Int. 2018; 2018:7301595. doi: 10.1155/2018/7301595.
- Lee MH, Huang YH, Chen HY, et al. Human leukocyte antigen variants and risk of hepatocellular carcinoma modified by hepatitis C virus genotypes: A genome-wide association study. Hepatology. 2018; 67(2): 651-661. doi: 10.1002/hep.29531.
- Zhao M, Qiu L, Tao N, et al. HLA DRB allele polymorphisms and risk of cervical cancer associated with human papillomavirus infection: a population study in China. Eur J Gynaecol Oncol. 2013; 34(1): 54-9.
- Paaso A, Jaakola A, Syrjänen S, et al. From HPV infection to lesion progression: The role of HLA alleles and host immunity. Acta Cytol. 2019; 63(2): 148-158. doi: 10.1159/000494985.
APPENDIX: Cancer prevalences (percent of population) for the 14 CWE countries studied. Numbers in the Cancer column indicate the cancer types in Table 1