
Immunogenetic Epidemiology of Motor Neuron Diseases in 14 Continental Western European Countries
Lisa M. James1,2,3, Apostolos P. Georgopoulos1,2,3,4*
1The HLA Research Group, Brain Sciences Center, Department of Veterans Affairs Health Care System, Minneapolis, MN, 55417, USA
2Department of Neuroscience, University of Minnesota Medical School, Minneapolis, MN 55455, USA
3Department of Psychiatry, University of Minnesota Medical School, Minneapolis, MN 55455, USA
4Department of Neurology, University of Minnesota Medical School, Minneapolis, MN 55455, USA
Abstract
Very few studies have evaluated associations of human leukocyte antigen (HLA) with motor neuron diseases (MND). Using an immunogenetic epidemiological approach, we identified a population-level HLA profile for MND by evaluating the correlations between the population frequencies of 127 HLA Class I and II alleles and the population prevalence of MND in 14 Continental Western European countries. The results demonstrated that significantly more HLA alleles, particularly for Class I, were negatively associated with the population prevalence of MND, suggesting a preponderance of protective vs susceptibility effects. The findings add to the limited literature implicating HLA in MND and considering the role of HLA in immune system responses to pathogens, suggest a potential influence of pathogens in MND.
Introduction
Motor neuron diseases (MND) are a highly disabling group of neurodegenerative diseases characterized by upper and/or lower motor neuron degeneration. Amyotrophic lateral sclerosis (ALS), which is the most common MND and the most extensively studied, initially involves muscle weakness or stiffness that progresses to gradual loss of voluntary movement with fatality typically occurring within a few years of onset1. Neuropathological features include loss of motor neurons as well as cytoplasmic inclusions that mirror those seen in frontotemporal dementia2. Indeed, as ALS progresses, cognitive symptoms often emerge with varying degrees of impairment up to and including dementia, commonly of the frontotemporal type3,4. Notably, the course, phenotype, and survival time of ALS have been shown to vary geographically in relation to population ancestral origin, pointing towards a modulatory influence of genetic and environmental factors that vary by population5. A number of genes have been implicated in ALS, many of which overlap with frontotemporal dementia6-8. Still, a significant percent of genetic influence of ALS remains unknown, especially in the case of sporadic ALS6. Environmental contributors to ALS are similarly uncertain. Several risk factors including smoking, physical activity, environmental and occupational exposures, head injuries, and diet have been investigated with varying degrees of support9,10. There is increasing evidence implicating microorganisms (e.g., viruses, bacteria) in ALS pathogenesis11. With regard to other MND, all of which are relatively rare, there is considerable heterogeneity in terms of signs, symptoms, and prognosis12. Furthermore, with the exception of spinal muscular atrophy and hereditary spastic paraplegia which are known to have a genetic basis, the cause of other motor neuron diseases is largely unknown12,13.
In light of the largely undetermined genetic influence on ALS and other motor neuron diseases and the potential etiological involvement of microorganisms, we focused here on the immunogenetic influence of human leukocyte antigen (HLA), a region of genes on chromosome 6 that are involved in immune response to foreign antigens. The two main classes of HLA – Class I (HLA-A, B, -C) and Class II (HLA-DR, -DQ, DP) - play a critical role in elimination of foreign antigens. Class I presents intracellular antigen peptides to CD8+ cytotoxic T cells which signals destruction of infected cells. Class II presents endocytosed extracellular antigen peptides to CD4+ T cells to promote B-cell mediated antibody production and adaptive immunity. A limited number of studies, largely using low-resolution HLA typing, have evaluated the influence of HLA on ALS with inconsistent findings14. A recent review of the literature indicated primarily Class I associations with ALS14; specifically, HLA-A*03, A*02, A*28; B*40, B*35, and C*04 have been found to promote susceptibility whereas A*09 is protective. A recent study in a Chinese population reported risk associated with a single nucleotide polymorphism in the DR gene, suggesting a role for HLA Class II in ALS15. These findings suggest an immunogenetic component to ALS; however, further study of HLA associations with ALS and other MND is warranted. The highly polymorphic nature of HLA presents a challenge in terms of identifying specific alleles that may be associated with rare diseases such as MNDs at the individual level. Therefore, we are utilizing a population immunogenetic approach to identify an HLA profile with regard to MND prevalence to better understand risk and protection associated with a wide range of HLA alleles. We have used a similar approach to identify HLA profiles for dementia, Parkinson’s disease, multiple sclerosis, and Type 1 diabetes16-20. This approach takes advantage of the population heterogeneity of HLA and utilizes high-resolution HLA genotyping to determine HLA alleles that are presumed to be protective (i.e., negatively associated) or susceptible (i.e., positively correlated) with regard to the population prevalence of a disease.
Materials and Methods
Prevalence of MND
The population prevalence of MND was computed for each of the following 14 countries in Continental Western Europe: Austria, Belgium, Denmark, Finland, France, Germany, Greece, Italy, Netherlands, Portugal, Norway, Spain, Sweden, and Switzerland. Specifically, the total number of people with MND in each of the 14 Continental Western European countries as determined by the Global Burden of Disease study21 was divided by the total population of each country in 2016 (Population Reference Bureau)22 and expressed as a percentage. The Global Burden of Disease study included ALS, spinal muscular atrophy, hereditary spastic paraplegia, primary lateral sclerosis, progressive muscular atrophy, and pseudobulbar palsy in its evaluation of the population characteristics of MND. We have previously shown that life expectancy for these countries is virtually identical17; therefore, life expectancy was not included in the current analyses.
HLA
The frequencies of all reported HLA alleles of classical genes of Class I (A, B, C) and Class II (DPB1, DQB1, DRB1) for each of the 14 Continental Western European countries were retrieved from the website allelefrequencies.net (Estimation of Global Allele Frequencies23,24) on October 20, 2020. There was a total of 2746 entries of alleles from the 14 Continental Western European countries, comprising 844 distinct alleles. Of those, 127 alleles occurred in 9 or more countries and were used in further analyses. This criterion is somewhat arbitrary but reasonable, since it encompasses ≥ 64.3% (≥ 9/14) of the whole sample of 14 countries. In addition, it was partially validated in a previous study16, where HLA-disease associations for dementia and Parkinson’s disease were congruent across a range of sample sizes.
The distribution of those alleles to the HLA classes and their genes is given in Table 1.
Table 1: Distribution of 127 HLA alleles analyzed to Class and Genes.
|
|
Class I (N = 69) |
Class II (N = 58) |
||||
|
Gene |
A |
B |
C |
DPB1 |
DQB1 |
DRB1 |
|
Count |
20 |
36 |
13 |
15 |
14 |
29 |
Data analysis
HLA profiles for MND were derived as described previously for other diseases16-20. Briefly, the prevalence of MND in a country was computed as the fraction of total country population and was expressed as a percentage. MND prevalences were natural-log transformed and the Pearson correlation coefficient, r, between MND prevalence and the population frequency of each one of the 127 HLA alleles above calculated and Fisher z−transformed25 to normalize its distribution:
r´ = atanh(r) (1)
The MND HLA profile consisted of 127 values of r´. The effects of HLA Class and gene (within a class) on r´ were evaluated using a univariate analysis of variance (ANOVA). Finally, differences in the proportions of the counts of negative and positive r´ were evaluated using the Wald H0 statistic for comparing proportions of independent samples. Statistical analyses were performed using the IBM−SPSS package (IBM SPSS Statistics for Windows, Version 26.0, 64−bit edition. Armonk, NY: IBM Corp; 2019) and Intel FORTRAN (Microsoft Visual Studio Community Version 16.8.3; Intel FORTRAN Compiler 2021).
Results
As mentioned above, the MND HLA profile consists of correlations between allele frequency and disease prevalence, suitably Fisher z-transformed (Equation 1) to normalize their distribution for further analyses. We showed previously17 that dementia prevalence varies in an exponential fashion with allele frequency, such that the logarithm of disease prevalence is a linear function of allele frequency. We found the same relation here between MND prevalence and HLA allele frequency. Two examples are illustrated in Figs. 1 and 2, namely for a presumed MND protective allele (A&26:01) and a susceptibility allele (B*40:01) (Fig. 1A and B, respectively).
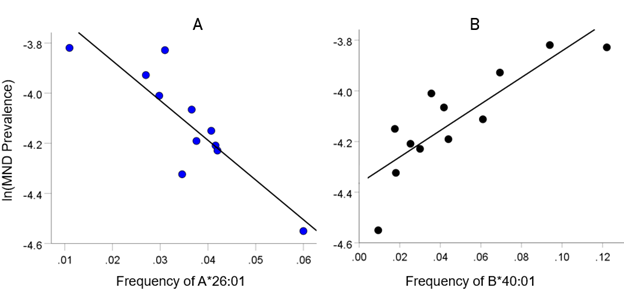
Figure 1: Example from a presumed protective HLA allele (A*26:01) and a presumed susceptibility allele (B*40:01) for MND. A, log-transformed MND prevalence (%) for 11 CWE countries is plotted against the corresponding frequency of the A*26:01 (P =0.0005). B, log-transformed MND prevalence (%) for 12 CWE countries is plotted against the corresponding frequency of the B*40:01 (P =0.0005).
HLA-MND profile
The frequency distribution of alleles in the HLA MND profile (Table 2) is shown in Fig. 2. There were 76/127 (59.8%) negative (protective) alleles and 51/127 (40.2%) positive (susceptibility) alleles. These percentages differed significantly from the null hypothesis of 50% (P = 0.027, two-sided one-sample binomial test; z = 2.218).
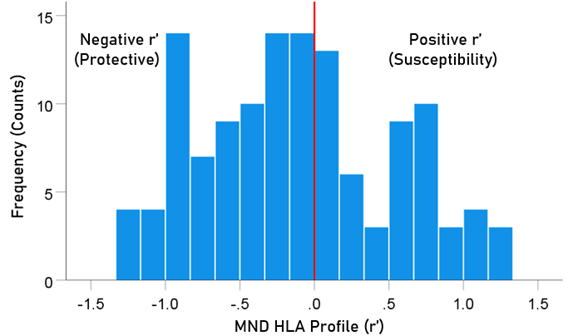
Figure 2. Frequency distribution of MND HLA profile (N = 127).
The distributions of r´ for Class I and II are shown in Fig. 3. There were 69/127 (54.3%) r´ in Class I and 58/127 (46.7%) in Class II; these percentages did not differ significantly from the 50-50% null hypothesis (P = 0.329, two-sided one-sample binomial test; z = 0.976). For Class I, there were 45/69 (65.2%) negative (protective) and 24/69 (34.8%) positive (susceptibility) values, respectively; these percentages differed significantly from the 50-50% null hypothesis (P = 0.011, two-sided one-sample binomial test; z = 2.528). For Class II, there were 31/58 (53.4%) negative and 27/58 (46.6%) positive values, respectively; these percentages did not differ significantly from the 50-50% null hypothesis (P = 0.599, two-sided one-sample binomial test; z = 0.535).
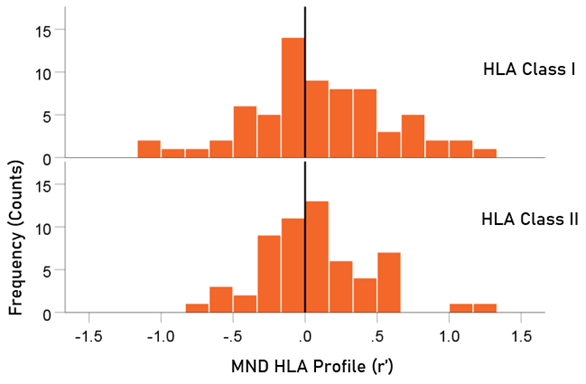
Figure 3. HLA Class distributions of MND HLA profile. N = 69 alleles for Class I and 58 alleles for Class II.
Table 2. HLA profile of MND. The signed z-transformed correlation coefficient (r´) between 127 HLA alleles and ln (MND) prevalence. N denotes the number of CWE countries from which r´ was calculated.
|
|
Allele |
Class |
N |
r´(MND) |
|
1 |
A*01:01 |
I |
11 |
−.360 |
|
2 |
A*02:01 |
I |
11 |
0.402 |
|
3 |
A*02:05 |
I |
9 |
−0.193 |
|
4 |
A*03:01 |
I |
11 |
1.080 |
|
5 |
A*11:01 |
I |
11 |
−0.682 |
|
6 |
A*23:01 |
I |
11 |
−0.636 |
|
7 |
A*24:02 |
I |
11 |
0.158 |
|
8 |
A*25:01 |
I |
12 |
0.083 |
|
9 |
A*26:01 |
I |
11 |
−1.322 |
|
10 |
A*29:01 |
I |
11 |
−0.016 |
|
11 |
A*29:02 |
I |
11 |
0.003 |
|
12 |
A*30:01 |
I |
11 |
−0.426 |
|
13 |
A*30:02 |
I |
12 |
−0.180 |
|
14 |
A*31:01 |
I |
9 |
0.929 |
|
15 |
A*32:01 |
I |
12 |
−1.282 |
|
16 |
A*33:01 |
I |
10 |
−0.116 |
|
17 |
A*33:03 |
I |
9 |
−0.957 |
|
18 |
A*36:01 |
I |
10 |
−0.354 |
|
19 |
A*68:01 |
I |
11 |
−0.094 |
|
20 |
A*68:02 |
I |
10 |
−0.132 |
|
21 |
B*07:02 |
I |
10 |
1.118 |
|
22 |
B*08:01 |
I |
12 |
0.407 |
|
23 |
B*13:02 |
I |
11 |
−0.269 |
|
24 |
B*14:01 |
I |
11 |
−0.040 |
|
25 |
B*14:02 |
I |
10 |
−0.104 |
|
26 |
B*15:01 |
I |
10 |
1.187 |
|
27 |
B*15:17 |
I |
9 |
−0.159 |
|
28 |
B*15:18 |
I |
9 |
−0.272 |
|
29 |
B*18:01 |
I |
12 |
−0.870 |
|
30 |
B*27:02 |
I |
10 |
0.182 |
|
31 |
B*27:05 |
I |
12 |
0.672 |
|
32 |
B*35:01 |
I |
11 |
0.025 |
|
33 |
B*35:02 |
I |
9 |
−0.577 |
|
34 |
B*35:03 |
I |
9 |
−1.046 |
|
35 |
B*35:08 |
I |
9 |
−0.830 |
|
36 |
B*37:01 |
I |
10 |
1.180 |
|
37 |
B*38:01 |
I |
9 |
−0.937 |
|
38 |
B*39:01 |
I |
11 |
−0.356 |
|
39 |
B*39:06 |
I |
9 |
−0.147 |
|
40 |
B*40:01 |
I |
12 |
1.247 |
|
41 |
B*40:02 |
I |
12 |
0.294 |
|
42 |
B*41:01 |
I |
11 |
−0.321 |
|
43 |
B*41:02 |
I |
10 |
−0.585 |
|
44 |
B*44:02 |
I |
12 |
0.064 |
|
45 |
B*44:03 |
I |
12 |
−0.154 |
|
46 |
B*44:05 |
I |
9 |
−0.843 |
|
47 |
B*45:01 |
I |
10 |
0.219 |
|
48 |
B*47:01 |
I |
11 |
−0.193 |
|
49 |
B*49:01 |
I |
11 |
−0.726 |
|
50 |
B*50:01 |
I |
10 |
−0.331 |
|
51 |
B*51:01 |
I |
10 |
−0.860 |
|
52 |
B*52:01 |
I |
10 |
−0.871 |
|
53 |
B*55:01 |
I |
11 |
0.324 |
|
54 |
B*56:01 |
I |
9 |
0.660 |
|
55 |
B*57:01 |
I |
12 |
−0.594 |
|
56 |
B*58:01 |
I |
9 |
−0.652 |
|
57 |
C*01:02 |
I |
9 |
0.510 |
|
58 |
C*03:03 |
I |
9 |
1.123 |
|
59 |
C*04:01 |
I |
9 |
−0.762 |
|
60 |
C*05:01 |
I |
9 |
0.509 |
|
61 |
C*06:02 |
I |
9 |
−0.542 |
|
62 |
C*07:01 |
I |
9 |
0.027 |
|
63 |
C*07:02 |
I |
9 |
1.098 |
|
64 |
C*07:04 |
I |
9 |
−0.589 |
|
65 |
C*12:02 |
I |
9 |
−0.897 |
|
66 |
C*12:03 |
I |
9 |
−1.158 |
|
67 |
C*14:02 |
I |
9 |
−0.943 |
|
68 |
C*15:02 |
I |
9 |
−0.909 |
|
69 |
C*16:01 |
I |
9 |
−0.0005 |
|
70 |
DPB1*01:01 |
II |
11 |
0.946 |
|
71 |
DPB1*02:01 |
II |
11 |
−0.934 |
|
72 |
DPB1*02:02 |
II |
10 |
−0.148 |
|
73 |
DPB1*03:01 |
II |
11 |
0.165 |
|
74 |
DPB1*04:01 |
II |
11 |
0.545 |
|
75 |
DPB1*04:02 |
II |
11 |
−0.190 |
|
76 |
DPB1*05:01 |
II |
11 |
0.747 |
|
77 |
DPB1*06:01 |
II |
10 |
0.289 |
|
78 |
DPB1*09:01 |
II |
9 |
−0.183 |
|
79 |
DPB1*10:01 |
II |
10 |
−0.567 |
|
80 |
DPB1*11:01 |
II |
9 |
0.133 |
|
81 |
DPB1*13:01 |
II |
10 |
−0.825 |
|
82 |
DPB1*14:01 |
II |
11 |
−0.918 |
|
83 |
DPB1*17:01 |
II |
9 |
−0.315 |
|
84 |
DPB1*19:01 |
II |
11 |
0.415 |
|
85 |
DQB1*02:01 |
II |
12 |
0.533 |
|
86 |
DQB1*02:02 |
II |
11 |
−0.278 |
|
87 |
DQB1*03:01 |
II |
13 |
−1.059 |
|
88 |
DQB1*03:02 |
II |
13 |
0.981 |
|
89 |
DQB1*03:03 |
II |
13 |
0.722 |
|
90 |
DQB1*04:02 |
II |
13 |
0.800 |
|
91 |
DQB1*05:01 |
II |
13 |
0.154 |
|
92 |
DQB1*05:02 |
II |
10 |
−1.206 |
|
93 |
DQB1*05:03 |
II |
12 |
−0.612 |
|
94 |
DQB1*06:01 |
II |
11 |
−0.371 |
|
95 |
DQB1*06:02 |
II |
14 |
0.733 |
|
96 |
DQB1*06:03 |
II |
13 |
0.310 |
|
97 |
DQB1*06:04 |
II |
12 |
0.048 |
|
98 |
DQB1*06:09 |
II |
9 |
−0.022 |
|
99 |
DRB1*01:01 |
II |
14 |
0.538 |
|
100 |
DRB1*01:02 |
II |
11 |
−0.477 |
|
101 |
DRB1*01:03 |
II |
11 |
−0.389 |
|
102 |
DRB1*03:01 |
II |
13 |
−0.004 |
|
103 |
DRB1*04:01 |
II |
13 |
0.666 |
|
104 |
DRB1*04:02 |
II |
11 |
−0.732 |
|
105 |
DRB1*04:03 |
II |
12 |
−0.952 |
|
106 |
DRB1*04:04 |
II |
13 |
0.833 |
|
107 |
DRB1*04:05 |
II |
9 |
−0.189 |
|
108 |
DRB1*04:07 |
II |
12 |
−0.145 |
|
109 |
DRB1*04:08 |
II |
9 |
0.798 |
|
110 |
DRB1*07:01 |
II |
12 |
−0.396 |
|
111 |
DRB1*08:01 |
II |
13 |
0.779 |
|
112 |
DRB1*08:03 |
II |
11 |
0.107 |
|
113 |
DRB1*09:01 |
II |
12 |
0.566 |
|
114 |
DRB1*10:01 |
II |
14 |
0.004 |
|
115 |
DRB1*11:01 |
II |
14 |
−0.354 |
|
116 |
DRB1*11:02 |
II |
12 |
−0.252 |
|
117 |
DRB1*11:03 |
II |
12 |
−1.002 |
|
118 |
DRB1*11:04 |
II |
12 |
−0.781 |
|
119 |
DRB1*12:01 |
II |
13 |
0.614 |
|
120 |
DRB1*13:01 |
II |
14 |
0.694 |
|
121 |
DRB1*13:02 |
II |
14 |
0.160 |
|
122 |
DRB1*13:03 |
II |
10 |
−0.862 |
|
123 |
DRB1*13:05 |
II |
10 |
−0.214 |
|
124 |
DRB1*14:01 |
II |
14 |
−0.471 |
|
125 |
DRB1*15:01 |
II |
13 |
0.689 |
|
126 |
DRB1*15:02 |
II |
10 |
−1.206 |
|
127 |
DRB1*16:01 |
II |
10 |
−0.899 |
Note. Strongest associations are denoted in bold.
Analysis of strength of r´
There were no statistically significant differences in the strength of r´ (|r´|) between the protective and susceptibility groups for either HLA class or gene (within a class) (P>0.05 for all comparisons, independent samples t-test).
Discussion
In the present study we used an immunogenetic epidemiological approach across 14 countries in Continental Western Europe to identify a population−level HLA profile consisting of protective and susceptibility alleles for MND. Few prior studies have evaluated HLA associations with ALS or other MND and most of those have focused on Class I alleles. Here we identified robust HLA-MND associations particularly involving Class I alleles but also several strong associations with Class II alleles. These findings, which suggest a broader influence of HLA on MND beyond the small number of Class I alleles that have been previously documented to be associated with MND, are discussed below.
Nearly 60% of the HLA alleles investigated here were negatively associated with the population prevalence of MND and presumed to be protective. Moreover, for Class I alleles in particular there were significantly more protective alleles than susceptibility alleles; Class II alleles did not significantly differ in terms of protection vs susceptibility. The relative rarity of MNDs26 may be partially related to the preponderance of protective (i.e., negatively correlated) alleles observed in the present study. These findings notably stand in contrast to prior research using the same approach that demonstrated a preponderance of susceptibility alleles in both dementia and Parkinson’s disease, two conditions that are much more frequent than MND16. Previous research has documented protective effects for A*0927. The current analyses included only those alleles that were present in at least 9 of the 14 countries; thus, A*09 was not included in the present analyses. Here, the strongest protective effects (i.e., negative correlations with the population prevalence of MND) were found for three Class I alleles (A*26:01, A*32:01, C*13:02) and for two Class II alleles (DRB1*15:02 and DQB1*05:02). In light of the evolutionary role of HLA in host protection from foreign antigens such as viruses and bacteria via T- cell and B-cell mediated immune mechanisms, we presume that the protective effects of Class I and Class II HLA alleles observed here are related to elimination of pathogens that have been implicated in MND11.
We have previously proposed that pathogen exposure in the absence of protective HLA results in persistent antigens that may promote disease through direct damage to cells and/or, in the presence of HLA susceptibility alleles, autoimmunity due to chronic inflammation16. With regard to ALS, accumulating evidence indicates autoimmune mechanisms against motor nerve terminals and voltage-dependent calcium channels result in apoptosis and neuronal death28. In addition, increased Class II HLA-DR expression in peripheral nerves of ALS patients has been suggested to reflect an autoimmune mechanism targeting Schwann cells29. Furthermore, evidence of inflammation in ALS as indicated by an increase in the number of microglial cells and reactive microglia displaying high levels of Class I and Class II HLA30,31. In the present study, both Class I and Class II HLA were associated with increased population prevalence of MND. The strongest positive associations were found for Class I alleles including B*07:02, B*15:01, B*37:01, B*40:01, C*03:03. Previous research has identified increased risk associated with B*40 as well as A*02, A*03, A*28, B*35, and C*0412, most of which were also associated with population susceptibility in the current study.
ALS, the most common MND, is considered to be part of a continuum with other neurodegenerative diseases including frontotemporal dementia and Parkinson’s disease10. The current findings suggest that immunogenetic mechanisms are part of that continuum. Indeed, similar to the present findings, HLA has been implicated in the population prevalence of several other neurodegenerative conditions including dementia, Parkinson’s disease, and multiple sclerosis16-20. Considering the evolutionary role of HLA in immune response to foreign antigens, these studies suggest a common role of foreign antigens (e.g., viruses, bacteria) in these neurodegenerative conditions. Work is ongoing in our lab to evaluate in silico the binding affinity of candidate antigens with specific HLA alleles32,33.
Identification of HLA-MND associations at the individual level is hampered by the infrequency of MND and the extreme polymorphism of HLA; prohibitively large samples of MND patients would be required to evaluate MND associations with the wide range of HLA alleles investigated here. In addition, the few prior studies evaluating HLA in relation to MND have often been limited by reliance on low-resolution HLA typing which masks important protein-level differences in disease associations. For instance, in the present analyses, DRB1*15:01 was positively associated with MND whereas DRB1*15:02 was negatively associated with MND. Protein level differences have been shown to alter the binding groove, shaping the repertoire of antigens that can bind and stimulate an immune response34. The current population level approach permits evaluation of numerous high−resolution Class I and Class II HLA alleles with MND prevalence. In addition, inclusion of data from several countries increases allele diversity and regional generalizability of the findings. That being said, the HLA-MND associations observed in these 14 Continental Western European countries may not extend to other regions given population variability in HLA35,36. In addition, our analyses are based on the Global Burden of Disease Study population counts of several conditions classified together as MND; however, HLA associations with each specific MND may vary and disease-specific HLA associations are not evaluated here. Finally, the analyses are based on correlations between the population frequency of HLA alleles and the population prevalence of MND; while the results provide compelling evidence of robust HLA-MND associations at the population level, additional studies are warranted to determine causal associations. We assume that HLA-MND associations implicate pathogens as a contributor to MND given the evolutionary role of HLA in pathogen elimination; however, the influence of specific pathogens on HLA-MND associations remains to be determined.
Conclusion
Compared to other neurodegenerative conditions research evaluating HLA associations with MND is limited. Here we evaluated immunogenetic influences on MND at the population level. The findings support a role of Class I and Class II HLA in the population prevalence of MND and extend the existing literature to identify a number of susceptibility and protective alleles. Considering the role of HLA in immune system responses to foreign antigens, these findings point to a potential contributory role of pathogens in MND.
Acknowledgments
Partial funding for this study was provided by the University of Minnesota (the Anita Kunin Chair in Women's Healthy Brain Aging, the Brain and Genomics Fund, the McKnight Presidential Chair of Cognitive Neuroscience, and the American Legion Brain Sciences Chair) and the U.S. Department of Veterans Affairs. The sponsors had no role in the current study design, analysis or interpretation, or in the writing of this paper. The contents do not represent the views of the U.S. Department of Veterans Affairs or the United States Government.
Conflicts of Interest
None.
Author Contributions
APG analyzed the data. LMJ and APG wrote the paper.
References
- Foster LA, Salajegheh MK. Motor neuron disease: pathophysiology, diagnosis, and management. Am J Med. 2019; 132(1): 32-7.
- Weishaupt JH, Hyman T, Dikic I. Common molecular pathways in amyotrophic lateral sclerosis and frontotemporal dementia. Trends Mol Med. 2016; 22(9): 769-83.
- Phukan J, Pender NP, Hardiman O. Cognitive impairment in amyotrophic lateral sclerosis. Lancet Neurol. 2007; 6(11): 994-1003.
- Phukan J, Elamin M, Bede P, et al. The syndrome of cognitive impairment in amyotrophic lateral sclerosis: a population-based study. J Neurol Neurosur Ps. 2012; 83: 102-108.
- Marin B, Logroscino G, Boumédiene F, et al. Clinical and demographic factors and outcome of amyotrophic lateral sclerosis in relation to population ancestral origin. Eur J Epidemiol. 2016; 31(3): 229-45.
- Renton A, Chiò A, Traynor B. State of play in amyotrophic lateral sclerosis genetics. Nat Neurosci. 2014; 17:17–23.
- Lattante S, Ciura S, Rouleau GA, et al. Defining the genetic connection linking amyotrophic lateral sclerosis (ALS) with frontotemporal dementia (FTD). Trends Genet. 2015; 31(5): 263-73.
- Nguyen HP, Van Broeckhoven C, van der Zee J. ALS genes in the genomic era and their implications for FTD. Trends Genet. 2018; 34(6): 404-23.
- Talbott EO, Malek AM, Lacomis D. The epidemiology of amyotrophic lateral sclerosis. Handb Clin Neurol. 2016; 138: 225-38.
- Zufiria M, Gil-Bea FJ, Fernandez-Torron R, et al. ALS: A bucket of genes, environment, metabolism and unknown ingredients. Prog Neurobiol. 2016; 142: 104-29.
- Castanedo-Vazquez D, Bosque-Varela P, Sainz-Pelayo A, et al. Infectious agents and amyotrophic lateral sclerosis: another piece of the puzzle of motor neuron degeneration. J Neurol. 2019; 266(1): 27-36.
- Talbot K. Motor neuron disease: the bare essentials. Practical Neurology. 2009; 9(5): 303-9.
- Dion P, Daoud H, Rlouleau G. Genetics of motor neuron disorders: new insights into pathogencic mechanisms. Nat Rev Genet. 2009; 10; 769-782.
- Misra MK, Damotte V, Hollenbach JA. The immunogenetics of neurological disease. Immunology. 2018; 153(4): 399-414.
- Yang X, Zheng J, Tian S, et al. HLA-DRA/HLA-DRB5 polymorphism affects risk of sporadic ALS and survival in a southwest Chinese cohort. J Neurol Sci. 2017; 373: 124-8.
- James LM, Georgopoulos AP. Immunogenetic epidemiology of dementia and Parkinson’s Disease in 14 continental European countries: shared human leukocyte antigen (HLA) profiles. J Immunological Sci. 2021; 5(2): 16−26.
- James LM, Georgopoulos AP. The human leukocyte antigen (HLA) DRB1*13:02 allele protects against dementia in continental Western Europe. J Neurol Neuromed. 2019; 4(5): 1−6.
- James LM, Georgopoulos AP. Tri−allelic human leukocyte antigen (HLA) protection against dementia. J Neurol Neuromed. 2020; 5(1): 12−17.
- James LM, Georgopoulos AP. Shared human leukocyte antigen (HLA) coverage in dementia and Parkinson’s disease. J Neurol Neuromed. 2020; 5(3): 45−54.
- James LM, Georgopoulos AP. Immunogenetic Epidemiology of Multiple Sclerosis in 14 Continental Western European Countries. J Immunological Sci. 2021; 5(2): 40-46
- Logroscino G, Piccininni M, Marin B, et al. Global, regional, and and national burden of motor neuron diseases 1990-2016: a systematic analysis for the Global Burden of Disease Study 2016. Lancet Neurol. 2018; 17(12): 1083-97.
- Population Reference Bureau. 2016 world population data sheet with a special focus on human needs and sustainable resources. Population Reference Bureau, Washington, DC, 2016. https://www. prb.org/2016−world−population−data−sheet/. Accessed February 5, 2019.
- Gonzalez−Galarza FF, Christmas S, Middleton D, et al. Allele frequency net: a database and online repository for immune gene frequencies in worldwide populations. Nucleic Acid Res. 2011; 39: D913–D919.
- Allele*Frequencies in Worldwide Populations [Internet]. Allele frequency net database (AFND) 2020 update. Liverpool, UK. Available from: http://allelefrequencies.net/hla6006a.asp
- Fisher RA. Statistical Methods for Research Workers. 13th ed. Edinburgh, Scotland: Oliver & Boyd; 1958.
- Feigin VL, Abajobir AA, Abate KH, et al. GBD 2015 Neurological Disorders Collaborator Group. Global, regional, and national burden of neurological disorders during 1990-2015: a systematic analysis for the Global Burden of Disease Study 2015. Lancet Neurol. 2017; 16(11): 877-97.
- Bartfeld H, Pollack MS, Cunningham-Rundles S, et al. HLA frequencies in amyotrophic lateral sclerosis. Arch Neurol. 1982; 39(5): 270-1.
- Pagani MR, Gonzalez LE, Uchitel OD. Autoimmunity in amyotrophic lateral sclerosis: past and present. Neurol Res International. 2011; 497080.
- Oliveira AL, Isozaki E, Younger D, et al. Expression of HLA-DR in peripheral nerve of amyotrophic lateral sclerosis. Arq Neuro-Psyquiat. 1994; 52(4): 493-500.
- Kawamata T, Akiyama H, Yamada T, et al. Immunologic reactions in amyotrophic lateral sclerosis brain and spinal cord tissue. Am J Pathol. 1992; 140(3): 691.
- Radford RA, Morsch M, Rayner SL, et al. The established and emerging roles of astrocytes and microglia in amyotrophic lateral sclerosis and frontotemporal dementia. Front Cell Neurosci. 2015; 9: 414.
- Charonis SA, James LM, Georgopoulos AP. In silico assessment of binding affinities of three dementia-protective Human Leukocyte Antigen (HLA) alleles to nine human herpes virus antigens. Curr Res Transl Med. 2020; 68(4): 211-6.
- James LM, Charonis SA, Georgopoulos AP. Association of dementia human leukocyte antigen (HLA) profile with human herpes viruses 3 and 7: An in silico investigation. J Immunological Sci. 2021; 5(3): 7-14.
- Hov R, Kosmoliaptsis V, Traherne JA, et al. Electrostatic modifications of the HLA-DR P9 peptide-binding pocket and susceptibility to primary sclerosing cholangitis. Hepatol. 2011; 53(6): 1967-1976.
- Garamszegi LZ. Global distribution of malaria−resistant MHC−HLA alleles: the number and frequencies of alleles and malaria risk. Malar J. 2014; 13: 349.
- Singh R, Kaul R, Kaul A, et al. A comparative review of HLA associations with hepatitis B and C viral infections across global populations. World J Gastroenterol. 2007; 13(12): 1770−87.