
Immunogenetic Epidemiology of Type 1 Diabetes in 14 Continental Western European Countries
Lisa M. James1,2,3, Apostolos P. Georgopoulos1,2,3,4*
1The HLA Research Group, Brain Sciences Center, Department of Veterans Affairs Health Care System, Minneapolis, MN, 55417, USA
2Department of Neuroscience, University of Minnesota Medical School, Minneapolis, MN 55455, USA
3Department of Psychiatry, University of Minnesota Medical School, Minneapolis, MN 55455, USA
4Department of Neurology, University of Minnesota Medical School, Minneapolis, MN 55455, USA
Abstract
Human leukocyte antigen (HLA) is widely recognized to influence individual Type 1 diabetes (T1D) risk. Here we utilized an immunogenetic epidemiological approach to evaluate the influence of HLA on T1D at the population level. Specifically, we evaluated the correlations between the population frequencies of 127 HLA Class I and II alleles and the population prevalence of T1D in 14 Continental Western European countries to identify a population-level HLA profile for T1D. The results of these analyses generally corroborated prior findings regarding the influence of HLA on T1D risk and protection and revealed several novel HLA-T1D associations. The findings, discussed within the context of the role of HLA in pathogen elimination and autoimmunity, point to a contributory role of exposure to pathogens in the absence of protective HLA in underlying the autoimmune destruction of pancreatic beta cells in T1D.
Introduction
Type 1 diabetes (T1D) is a chronic disorder characterized by insulin deficiency and dysregulation of glucose metabolism resulting from destruction of pancreatic beta cells1. The majority of T1D cases are autoimmune-mediated2. The prevalence of T1D is increasing and varies globally with several European countries (e.g., Finland, Sardinia) exhibiting the highest rates worldwide3. The prevailing theory of T1D etiology emphasizes genetic risk coupled with an environmental trigger that results in a pancreatic islet cell autoimmunity and loss of B-cells4, although the disease course and progression is variable1,5. Several environmental exposures have been associated with T1D. Enteroviruses (e.g., Coxsackievirus B; CVB) are the primary viral candidates for causing type 1 diabetes1,6; however, additional viruses (e.g., rotavirus, mumps virus, and cytomegalovirus)6 have also been implicated. Other environmental factors including vitamin D, diet, and gut-microbiome diversity have also been shown to influence T1D risk and protection7.
In terms of genetic risk, at least half of the genetic risk for T1D is attributed to the human leukocyte antigen (HLA) region on chromosome 68. HLA genes, the most highly polymorphic of the human genome, code for cell-surface proteins that facilitate elimination of foreign antigens. HLA Class I molecules (HLA-A, -B, -C) present intracellular antigen peptides to CD8+ cytotoxic T cells, signaling destruction of infected cells whereas HLA Class II molecules (HLA-DR, DQ, and DP genes) present endocytosed extracellular antigen peptides to CD4+ T cells to promote B-cell mediated antibody production and adaptive immunity. Thus, the evolutionary role of HLA is host protection against foreign antigens; however, HLA is also implicated in a number of autoimmune disorders including T1D9. Several HLA Class II alleles, including DRB1 0401, DRB1 0402, DRB1 0405, DQA1 0301, DQB1 0302 or DQB1 0201 alleles and haplotypes, have been associated with T1D risk and protection10. Two Class II haplotypes - DRB1*0401-DQB1*0302 and DRB1*0301-DQB1*0201 – have been shown to confer the greatest risk in individuals of European descent whereas others (e.g., DRB1*1501--DQB1-0602, DRB1*1401- DQB1*0503, and DRB1*0701- DQB1*0303) are protective11. Although Class II alleles are most robustly associated with T1D, Class I alleles have also been associated with both T1D risk and protection, even after accounting for linkage disequilibrium effects with Class II alleles12. Of the Class I alleles, A*24:02 and HLA-B*39:06 has been most clearly associated with T1D risk and HLA-B*57:01 with protection although numerous other Class I-T1D associations have been identified12-14. Notably, more than 60% of T1D patients do not have the highest-risk genotype15, highlighting the need to understand risk and protection associated with other HLA alleles.
Here we take an immunogenetic epidemiology approach16-20 to identify an HLA profile with regard to T1D disease prevalence to better understand risk and protection associated with a wide range of HLA alleles. Specifically, this approach rests on the correlations between the frequency of HLA alleles in a given population with the population prevalence of a disease. This approach takes advantage of the population heterogeneity of HLA and utilizes high-resolution HLA genotyping to determine HLA alleles that are presumed to be protective (i.e., negatively associated) or susceptible (i.e., positively correlated) with regard to the population prevalence of T1D. In light of the role of HLA in pathogen elimination and autoimmunity, this immunogenetic epidemiology approach provides novel insights into the pathogenesis of T1D at the population-level as well as the variability of T1D prevalence across populations.
Materials and Methods
Prevalence of T1D
The population prevalence of T1D was computed for each of the following 14 countries in Continental Western Europe: Austria, Belgium, Denmark, Finland, France, Germany, Greece, Italy, Netherlands, Portugal, Norway, Spain, Sweden, and Switzerland. Specifically, the total number of people with T1D in each of the 14 Continental Western European countries was identified from the Global Health Data Exchange21, a publicly available catalog of data from the Global Burden of Disease study, the most comprehensive worldwide epidemiological study of more than 350 diseases. The Global Health Data Exchange includes epidemiological data separately for Type 1 and Type 2 diabetes; for the present study, only the prevalence data for Type 1 diabetes was obtained. T1D prevalence in each country was divided by the total population of each country in 2016 (Population Reference Bureau)22 and expressed as a percentage. We have previously shown that life expectancy for these countries is virtually identical17; therefore, life expectancy was not included in the current analyses.
HLA
The frequencies of all reported HLA alleles of classical genes of Class I (A, B, C) and Class II (DPB1, DQB1, DRB1) for each of the 14 Continental Western European countries were retrieved from the website allelefrequencies.net (Estimation of Global Allele Frequencies23,24) on October 20, 2020. Details of the query are shown in Fig. 1.
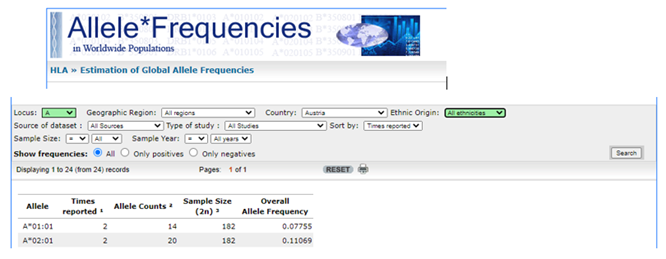
Figure 1: Snapshot of the HLA search performed for each combination of Locus (A, B, C, DPB1, DQB1, DRB1) and Country (14 CWE countries). The Overall Allele Frequency (right-most column) of each Allele (left-most column) was tabulated and analyzed. In the example shown, Locus A and Austria were selected, yielding 24 records, of which the first 2 are shown.
There was a total of 2746 entries of alleles from the 14 Continental Western European countries, comprising 844 distinct alleles, i.e., alleles that occurred in at least one country. Of those, 127 alleles occurred in 9 or more countries and were used in further analyses. This criterion is somewhat arbitrary but reasonable; it was partially validated in a previous study16, as discussed below.
The distribution of those alleles to the HLA classes and their genes is given in Table 1.
Table 1. Distribution of 127 HLA alleles analyzed to Class and Genes.
|
|
Class I (N = 69 alleles) |
Class II (N = 58 alleles) |
||||
|
Gene |
A |
B |
C |
DPB1 |
DQB1 |
DRB1 |
|
Count |
20 |
36 |
13 |
15 |
14 |
29 |
Data analysis
HLA profiles for T1D were derived as described previously for Parkinson’s disease, dementia, and multiple sclerosis16,20. Briefly, the prevalence of T1D in a country was computed as the fraction of total country population and was expressed as a percentage. T1D prevalences were natural-log transformed and the Pearson correlation coefficient, r, between T1D prevalence and the population frequency of each one of the 127 HLA alleles above calculated and Fisher z−transformed25 to normalize its distribution:
r´ = atanh(r) (1)
The T1D HLA profile consisted of 127 values of r´. The effects of HLA Class and gene (within a class) on r´ were evaluated using a univariate analysis of variance (ANOVA). Finally, differences in the proportions of the counts of negative and positive r´ were evaluated using the Wald H0 statistic for comparing proportions of independent samples. Statistical analyses were performed using the IBM−SPSS package (IBM SPSS Statistics for Windows, Version 26.0, 64−bit edition. Armonk, NY: IBM Corp; 2019) and Intel FORTRAN (Microsoft Visual Studio Community Version 16.8.3; Intel FORTRAN Compiler 2021).
Results
As mentioned above, the T1D HLA profile consists of correlations between allele frequency and disease prevalence, suitably Fisher z-transformed (Equation 1) to normalize their distribution for further analyses. We showed previously17 that dementia prevalence varies in an exponential fashion with allele frequency, such that the logarithm of disease prevalence is a linear function of allele frequency. We found the same relation here between T1D prevalence and HLA allele frequency. Two examples are illustrated in Fig. 2, namely for a presumed T1D protective allele (A*01:01) and a susceptibility allele (DQB1*03:02) (Fig. 2A and B, respectively).
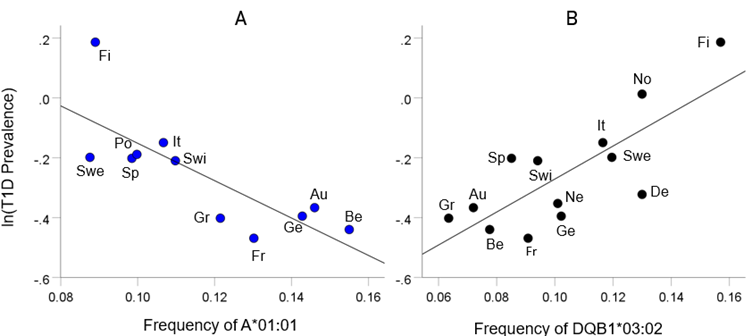
Figure 2: Example from a presumed protective HLA allele (A*01:01) and a presumed susceptibility allele (DQB1*03:02) for T1D. A, log-transformed T1D prevalence (%) for 11 CWE countries is plotted against the corresponding frequency of the A*01:01 (P =0.004). B, log-transformed T1D prevalence (%) for 13 CWE countries is plotted against the corresponding frequency of the DQB1*03:02 (P =0.002). Abbreviations: Au, Austria; Be, Belgium; De, Denmark; Fi, Finland; Fr, France; Ge, Germany; Gr, Greece; It, Italy; Ne, Netherlands; No, Norway; Po, Portugal; Sp, Spain; Swe, Sweden; Swi, Switzerland.
HLA-T1D profile
The frequency distribution of alleles in the T1D HLA profile (Table 2) is shown in Fig. 3. There were 57/127 (44.9%) negative (protective) alleles and 70/127 (55.1%) positive (susceptibility) alleles. These percentages did not differ significantly from the null hypothesis of 50% (P = 0.249, two-sided one-sample binomial test; z = 1.154).
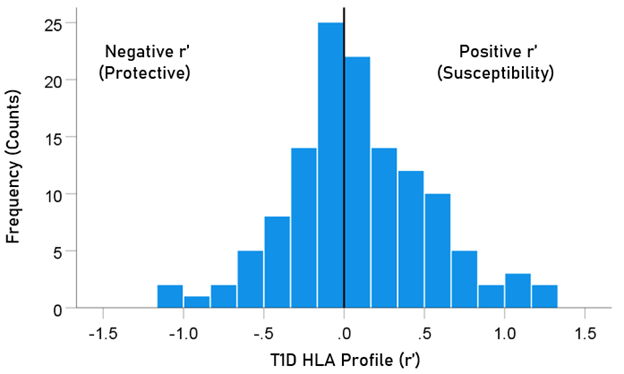
Figure 3: Frequency distribution of T1D HLA profile (N = 127).
The distributions of r´ for Class I and II are shown in Fig. 4. There were 69/127 (54.3%) r´ in Class I and 58/127 (46.7%) in Class II; these percentages did not differ significantly (P = 0.329, two-sided one-sample binomial test; z = 0.976). For Class I, there were 31/69 (44.9%) negative (protective) and 38/69 (55.1%) positive (susceptibility) values, respectively; these percentages did not differ significantly (P = 0.399, two-sided one-sample binomial test; z = 0.843). For Class II, there were 26/58 (44.8%) negative and 32/58 (55.2%) positive values, respectively; these percentages did not differ significantly (P = 0.431, two-sided one-sample binomial test; z = 0.788).
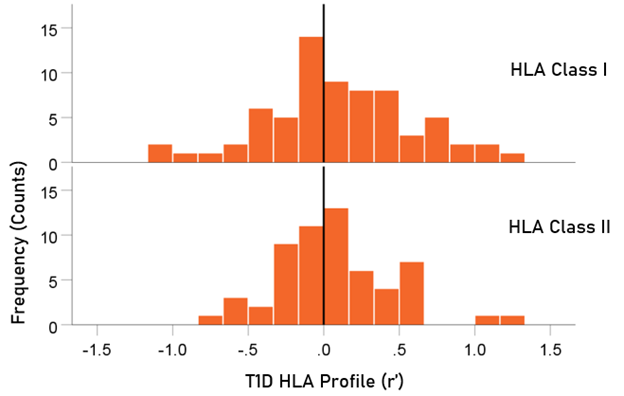
Figure 4. HLA Class distributions of T1D HLA profile. N = 69 alleles for Class I and 58 alleles for Class II.
Table 2. HLA profile of T1D. The signed z-transformed correlation coefficient (r´) between 127 HLA alleles and ln(T1D) prevalence. N denotes the number of CWE countries from which r´ was calculated.
|
|
Allele |
Class |
N |
r´(T1D) |
|
1 |
A*01:01 |
I |
11 |
−1.064 |
|
2 |
A*02:01 |
I |
11 |
0.280 |
|
3 |
A*02:05 |
I |
9 |
1.317 |
|
4 |
A*03:01 |
I |
11 |
0.477 |
|
5 |
A*11:01 |
I |
11 |
−0.012 |
|
6 |
A*23:01 |
I |
11 |
−0.156 |
|
7 |
A*24:02 |
I |
11 |
0.205 |
|
8 |
A*25:01 |
I |
12 |
−0.088 |
|
9 |
A*26:01 |
I |
11 |
−0.677 |
|
10 |
A*29:01 |
I |
11 |
0.550 |
|
11 |
A*29:02 |
I |
11 |
0.088 |
|
12 |
A*30:01 |
I |
11 |
−0.163 |
|
13 |
A*30:02 |
I |
12 |
0.036 |
|
14 |
A*31:01 |
I |
9 |
0.203 |
|
15 |
A*32:01 |
I |
12 |
−0.386 |
|
16 |
A*33:01 |
I |
10 |
1.032 |
|
17 |
A*33:03 |
I |
9 |
−0.068 |
|
18 |
A*36:01 |
I |
10 |
1.058 |
|
19 |
A*68:01 |
I |
11 |
−0.295 |
|
20 |
A*68:02 |
I |
10 |
−0.091 |
|
21 |
B*07:02 |
I |
10 |
−0.153 |
|
22 |
B*08:01 |
I |
12 |
−0.361 |
|
23 |
B*13:02 |
I |
11 |
−0.392 |
|
24 |
B*14:01 |
I |
11 |
0.697 |
|
25 |
B*14:02 |
I |
10 |
0.861 |
|
26 |
B*15:01 |
I |
10 |
0.092 |
|
27 |
B*15:17 |
I |
9 |
0.499 |
|
28 |
B*15:18 |
I |
9 |
−0.065 |
|
29 |
B*18:01 |
I |
12 |
0.009 |
|
30 |
B*27:02 |
I |
10 |
0.655 |
|
31 |
B*27:05 |
I |
12 |
0.177 |
|
32 |
B*35:01 |
I |
11 |
0.723 |
|
33 |
B*35:02 |
I |
9 |
0.324 |
|
34 |
B*35:03 |
I |
9 |
0.054 |
|
35 |
B*35:08 |
I |
9 |
0.020 |
|
36 |
B*37:01 |
I |
10 |
0.150 |
|
37 |
B*38:01 |
I |
9 |
0.604 |
|
38 |
B*39:01 |
I |
11 |
−0.061 |
|
39 |
B*39:06 |
I |
9 |
0.360 |
|
40 |
B*40:01 |
I |
12 |
0.375 |
|
41 |
B*40:02 |
I |
12 |
0.054 |
|
42 |
B*41:01 |
I |
11 |
0.444 |
|
43 |
B*41:02 |
I |
10 |
0.254 |
|
44 |
B*44:02 |
I |
12 |
−0.537 |
|
45 |
B*44:03 |
I |
12 |
−0.176 |
|
46 |
B*44:05 |
I |
9 |
0.067 |
|
47 |
B*45:01 |
I |
10 |
−0.114 |
|
48 |
B*47:01 |
I |
11 |
0.481 |
|
49 |
B*49:01 |
I |
11 |
0.428 |
|
50 |
B*50:01 |
I |
10 |
0.827 |
|
51 |
B*51:01 |
I |
10 |
−0.136 |
|
52 |
B*52:01 |
I |
10 |
−0.214 |
|
53 |
B*55:01 |
I |
11 |
−0.211 |
|
54 |
B*56:01 |
I |
9 |
0.828 |
|
55 |
B*57:01 |
I |
12 |
−0.380 |
|
56 |
B*58:01 |
I |
9 |
0.394 |
|
57 |
C*01:02 |
I |
9 |
0.939 |
|
58 |
C*03:03 |
I |
9 |
0.729 |
|
59 |
C*04:01 |
I |
9 |
0.280 |
|
60 |
C*05:01 |
I |
9 |
−0.093 |
|
61 |
C*06:02 |
I |
9 |
−0.916 |
|
62 |
C*07:01 |
I |
9 |
−0.630 |
|
63 |
C*07:02 |
I |
9 |
0.326 |
|
64 |
C*07:04 |
I |
9 |
−1.020 |
|
65 |
C*12:02 |
I |
9 |
−0.337 |
|
66 |
C*12:03 |
I |
9 |
−0.315 |
|
67 |
C*14:02 |
I |
9 |
−0.443 |
|
68 |
C*15:02 |
I |
9 |
−0.004 |
|
69 |
C*16:01 |
I |
9 |
−0.049 |
|
70 |
DPB1*01:01 |
II |
11 |
0.596 |
|
71 |
DPB1*02:01 |
II |
11 |
−0.198 |
|
72 |
DPB1*02:02 |
II |
10 |
0.132 |
|
73 |
DPB1*03:01 |
II |
11 |
0.331 |
|
74 |
DPB1*04:01 |
II |
11 |
0.066 |
|
75 |
DPB1*04:02 |
II |
11 |
−0.075 |
|
76 |
DPB1*05:01 |
II |
11 |
0.557 |
|
77 |
DPB1*06:01 |
II |
10 |
−0.047 |
|
78 |
DPB1*09:01 |
II |
9 |
0.427 |
|
79 |
DPB1*10:01 |
II |
10 |
−0.352 |
|
80 |
DPB1*11:01 |
II |
9 |
0.337 |
|
81 |
DPB1*13:01 |
II |
10 |
−0.790 |
|
82 |
DPB1*14:01 |
II |
11 |
−0.282 |
|
83 |
DPB1*17:01 |
II |
9 |
−0.038 |
|
84 |
DPB1*19:01 |
II |
11 |
0.158 |
|
85 |
DQB1*02:01 |
II |
12 |
0.176 |
|
86 |
DQB1*02:02 |
II |
11 |
−0.132 |
|
87 |
DQB1*03:01 |
II |
13 |
−0.648 |
|
88 |
DQB1*03:02 |
II |
13 |
1.031 |
|
89 |
DQB1*03:03 |
II |
13 |
0.233 |
|
90 |
DQB1*04:02 |
II |
13 |
0.501 |
|
91 |
DQB1*05:01 |
II |
13 |
−0.297 |
|
92 |
DQB1*05:02 |
II |
10 |
−0.123 |
|
93 |
DQB1*05:03 |
II |
12 |
−0.111 |
|
94 |
DQB1*06:01 |
II |
11 |
−0.503 |
|
95 |
DQB1*06:02 |
II |
14 |
0.198 |
|
96 |
DQB1*06:03 |
II |
13 |
0.129 |
|
97 |
DQB1*06:04 |
II |
12 |
−0.559 |
|
98 |
DQB1*06:09 |
II |
9 |
−0.084 |
|
99 |
DRB1*01:01 |
II |
14 |
0.092 |
|
100 |
DRB1*01:02 |
II |
11 |
0.578 |
|
101 |
DRB1*01:03 |
II |
11 |
0.056 |
|
102 |
DRB1*03:01 |
II |
13 |
0.031 |
|
103 |
DRB1*04:01 |
II |
13 |
0.131 |
|
104 |
DRB1*04:02 |
II |
11 |
0.183 |
|
105 |
DRB1*04:03 |
II |
12 |
0.021 |
|
106 |
DRB1*04:04 |
II |
13 |
0.160 |
|
107 |
DRB1*04:05 |
II |
9 |
0.563 |
|
108 |
DRB1*04:07 |
II |
12 |
0.058 |
|
109 |
DRB1*04:08 |
II |
9 |
0.547 |
|
110 |
DRB1*07:01 |
II |
12 |
−0.369 |
|
111 |
DRB1*08:01 |
II |
13 |
0.553 |
|
112 |
DRB1*08:03 |
II |
11 |
0.089 |
|
113 |
DRB1*09:01 |
II |
12 |
0.225 |
|
114 |
DRB1*10:01 |
II |
14 |
−0.083 |
|
115 |
DRB1*11:01 |
II |
14 |
−0.281 |
|
116 |
DRB1*11:02 |
II |
12 |
0.443 |
|
117 |
DRB1*11:03 |
II |
12 |
−0.231 |
|
118 |
DRB1*11:04 |
II |
12 |
−0.120 |
|
119 |
DRB1*12:01 |
II |
13 |
1.177 |
|
120 |
DRB1*13:01 |
II |
14 |
0.381 |
|
121 |
DRB1*13:02 |
II |
14 |
−0.266 |
|
122 |
DRB1*13:03 |
II |
10 |
−0.194 |
|
123 |
DRB1*13:05 |
II |
10 |
−0.142 |
|
124 |
DRB1*14:01 |
II |
14 |
−0.126 |
|
125 |
DRB1*15:01 |
II |
13 |
0.059 |
|
126 |
DRB1*15:02 |
II |
10 |
−0.214 |
|
127 |
DRB1*16:01 |
II |
10 |
−0.260 |
Effect of Sample Size
The sample size for estimates of r´ varied from 9 to 14 (Table 2). We evaluated a possible effect of sample size on r´ by performing a univariate analysis of variance where r´ was the dependent variable and the sample size N was random factor. The effect of N was not statistically significant (F[5,121] = 1.185, P = 0.32); in addition, the mean r´ from any sample did not differ significantly from any other. These results document the lack of bias of sample size on r´.
Analysis of Strength of r´
There were no statistically significant differences in the strength of r´ (|r´|) between the negative (protective) and positive (susceptibility) groups for either HLA class or gene (within a class) (P>0.05 for all comparisons, independent samples t-test).
Discussion
In an extension of our previous work on HLA-disease profiles16-20, we used an immunogenetic epidemiological approach across 14 countries in Continental Western Europe to identify a population−level HLA profile consisting of protective and susceptibility alleles for T1D. We used the Fisher z-transformed correlation r´ between T1D prevalence and HLA allele frequency as a continuous, signed measure of association, where the sign of r´ indicates the direction of association (negative/protective, positive/susceptibility) and its absolute value |r´| indicates the strength of association. We computed r´ for samples sizes of N ≥ 9 countries, a reasonable threshold. Although estimates of r´ from smaller sample sizes gave robust outcomes for the association of HLA profiles of dementia and Parkinson’s disease (see Table 7 in ref.16), we deemed it appropriate to stay with the more conservative threshold of N ≥ 9 countries; for the sample sizes used of 9-14 countries, there were no statistically significant differences between estimates of r´.
The results are generally consistent with extant literature regarding HLA associations with T1D and identify several novel HLA-T1D associations. Of the 127 HLA alleles, 70 were positively associated with the population prevalence of T1D and are presumed to reflect population-level susceptibility. The strongest positive associations with T1D prevalence were found for HLA-A*02:05, DRB1*12:01, A*36:01, A*33:01, and DQB1*03:02, in that order, as shown in Table 2. DQB1*03:02 is part of a haplotype that has well-established associations with T1D11. Other alleles associated with high-risk T1D haplotypes (e.g., DRB1*0401, DRB1*0301, DQB1*0201) were also positively associated with the population prevalence of T1D here albeit less so. Previous research has shown that DPB1*03:02 and DPB1*02:02 also increased risk of T1D15. Consistent with those findings, both of those alleles were positively associated with T1D prevalence in the current study. Similarly, of the Class I alleles, HLA-B*39:06 has been shown to be strongly associated with T1D risk12. Here, too, the association of B*39:06 and the population prevalence of T1D was positive, though several other Class I alleles were more strongly associated with risk for T1D.
Several HLA alleles were also found to be negatively associated with the population prevalence of T1D and are presumed to be protective. The most protective alleles in this population-level study were A*01:01, C*07:04, C*06:02, DPB1*13:01, and A*26:01, in that order, as shown in Table 2. Previous studies have similarly found protective effects for three of these five protective alleles - A*01:0114 and C*06:02 and C*07:0412. A large international collaborative study demonstrated protective effects of numerous Class I alleles with the strongest protective effects observed for A*11:01, B*07:02, B*44:03, B*57:01, C*04:01, C*07:02, and C*16:0112. With two exceptions (C*04:01 and C*07:02), we also found these alleles to be protective. Finally, prior studies have identified protective Class II haplotypes including DRB1*1501--DQB1-0602; DRB1*1401- DQB1*0503, and DRB1*0701- DQB1*030311. In this population-level study we did not evaluate the influence of haplotypes on T1D; nonetheless, our population immunogenetic approach similarly found protective effects of DRB1*14:01, DQB1*0503, and DRB1*07:01 alleles on T1D prevalence
The protective and susceptibility effects identified here point to population-level immunogenetic influences on T1D and add to the literature in terms of identifying several Class I and Class II HLA alleles that are associated with population-level immunogenetic susceptibility to T1D. However, T1D is thought to result (in most cases) from genetic susceptibility coupled with an uncertain environmental trigger. Given the evolutionary role of HLA in host protection from foreign antigens such as viruses and bacteria, the present findings documenting several strong positive and negative HLA associations with T1D implicate exposure to pathogens as a potential trigger in T1D. Indeed, a number of viruses have been implicated in T1D including, most prominently, enteroviruses6. We presume that protective alleles identified here facilitate pathogen elimination that could otherwise contribute to T1D whereas susceptibility alleles promote autoimmune destruction of pancreatic beta cells through an uncertain mechanism that could include viral persistence or molecular mimicry with viral epitopes26. Certainly, non-viral population-level environmental factors such as diet may also contribute to T1D. Population level differences in pathogen exposure, diet, or other environmental factors coupled with geographic and ethnic variability in HLA27,28 may partially account for the global difference in T1D prevalence.
There are several strengths of the immunogenetic epidemiological approach used here. The ability to evaluate the association of a large number of high−resolution Class I and Class II HLA alleles with T1D prevalence across countries is a significant strength of the current study as low−resolution HLA genotyping has been shown to mask important protein−level differences in HLA-T1D associations15 and reliance on a single country may limit allelic variation and reduce regional generalizability. An additional strength of this approach is that population-level analyses permit large-scale HLA-disease association analyses that minimize the influence of individual difference variables that may otherwise confound HLA-disease association studies in individuals or cohorts. Finally, this immunogenetic epidemiological approach is beneficial for identifying immunogenetic contributions to population-level disease variability. The applicability of these population-level findings to individual T1D risk and protection await validation; however, given the heterogeneity of HLA, prohibitively large samples are typically needed for cohort studies aimed at evaluating the presence or absence of a large number of HLA genes in individuals with T1D compared to healthy controls.
Despite strengths of this immunogenetic epidemiological study of T1D, several qualifications and limitations must also be considered. First, the HLA−T1D associations observed in these 14 Continental Western European countries may not extend to other countries within Western Europe that were not investigated here or to other regions. Indeed, HLA-T1D associations have been shown to vary geographically3,15; thus, a similar population-level approach in different regions will be useful for determining regional similarities or differences in HLA-T1D associations. Such analyses are underway in our lab. Second, several haplotypes have been associated with individual risk for T1D11,15. Since our study was aimed at population-level analyses, we focused instead on the influence of the population frequency of individual alleles on T1D prevalence. Overall, the direction of effects in terms of susceptibility or protection were remarkably similar in our population-level findings and previous disease-association studies evaluating allele or haplotype associations with T1D. Third, the current study is focused on T1D prevalence; the extent to which HLA is associated with other epidemiological T1D measures such as incidence and mortality remain to be investigated. Furthermore, the prevalence data used here assumes accurate classification of T1D; however, it is possible that T1D prevalence is misestimated due to misclassification of T1D as Type 2 diabetes29. Finally, T1D is generally thought to result from an environmental trigger coupled with genetic susceptibility. Although HLA associations with T1D implicate pathogens as relevant environmental triggers, evaluation of specific pathogenic influences is beyond the scope of the current paper. Similarly, since the present study was specifically aimed at evaluating the contribution of HLA to T1D, the influence of other genetic30 and environmental factors was not evaluated in the present study. Certainly, HLA is one of many factors contributing to variability in T1D prevalence.
Conclusion
It is well established that HLA significantly influences individual risk for T1D. Here we evaluated immunogenetic influences on T1D at the population level. The findings were highly similar with the extant literature regarding individual susceptibility and protective alleles and several novel HLA-T1D associations were identified. In light of the role of HLA in pathogen elimination and autoimmunity, these findings point to a contributory role of exposure to pathogens in the absence of protective HLA as partially underlying T1D.
Acknowledgments
Partial funding for this study was provided by the University of Minnesota (the Anita Kunin Chair in Women's Healthy Brain Aging, the Brain and Genomics Fund, the McKnight Presidential Chair of Cognitive Neuroscience, and the American Legion Brain Sciences Chair) and the U.S. Department of Veterans Affairs. The sponsors had no role in the current study design, analysis or interpretation, or in the writing of this paper. The contents do not represent the views of the U.S. Department of Veterans Affairs or the United States Government./p>
References
- DiMeglio LA, Evans-Molina C, Oram RA. Type 1 diabetes. Lancet. 2018; 391(10138): 2449-62.
- Atkinson MA, Eisenbarth GS, Michels AW. Type 1 diabetes. Lancet. 2014; 383(9911): 69-82.
- Maahs DM, West NA, Lawrence JM, et al. Epidemiology of type 1 diabetes. Endocrinol Metab. 2010; 39(3): 481-97.
- Eisenbarth GS. Type I diabetes mellitus. A chronic autoimmune disease. N Engl J Med. 1986; 314: 1360–1368.
- Ziegler AG, Rewers M, Simell O, et al. Seroconversion to multiple islet autoantibodies and risk of progression to diabetes in children. JAMA. 2013; 309: 2473–79.
- Filippi CM, von Herrath MG. Viral trigger for type 1 diabetes: pros and cons. Diabetes. 2008; 57(11): 2863-71.
- Rewers M, Ludvigsson J. Environmental risk factors for type 1 diabetes. Lancet 2016; 387: 2340–48.
- Noble JA, Erlich HA. Genetics of type 1 diabetes. CSH Perspect Med. 2012; 2(1): a007732.
- Gough SC, Simmonds MJ. The HLA region and autoimmune disease: associations and mechanisms of action. Curr Genomics. 2007; 8(7): 453−65.
- Noble JA, Valdes AM. Genetics of the HLA region in the prediction of type 1 diabetes. Curr Diabetes Rep. 2011; 11(6): 533.
- Erlich H, Valdes AM, Noble J, et al. HLA DR-DQ haplotypes and genotypes and type 1 diabetes risk: analysis of the type 1 diabetes genetics consortium families. Diabetes. 2008; 57: 1084–92.
- Noble JA, Valdes AM, Varney MD, et al. HLA class I and genetic susceptibility to type 1 diabetes: results from the type 1 Diabetes Genetics Consortium. Diabetes. 2010; 59: 2972–79.
- Noble JA, Valdes AM, Bugawan TL, et al. The HLA class I A locus affects susceptibility to type 1 diabetes. Hum Immunol. 2002; 63: 657.
- Valdes AM, Erlich HA, Noble JA. Human leukocyte antigen class IB and C loci contribute to Type 1 Diabetes (T1D) susceptibility and age at T1D onset. Hum Immunol. 2005; 66(3): 301-13.
- Noble JA. Immunogenetics of type 1 diabetes: a comprehensive review. J Autoimmun. 2015; 64: 101-12.
- James LM, Georgopoulos AP. Immunogenetic epidemiology of dementia and Parkinson’s Disease in 14 continental European countries: shared human leukocyte antigen (HLA) profiles. J Immunological Sci. 2021; 5(2): 16−26.
- James LM, Georgopoulos AP. The human leukocyte antigen (HLA) DRB1*13:02 allele protects against dementia in continental Western Europe. J Neurol Neuromed. 2019; 4(5): 1−6.
- James LM, Georgopoulos AP. Tri−allelic human leukocyte antigen (HLA) protection against dementia. J Neurol Neuromed. 2020; 5(1): 12−17.
- James LM, Georgopoulos AP. Shared human leukocyte antigen (HLA) coverage in dementia and Parkinson’s disease. J Neurol Neuromed. 2020; 5(3): 45−54.
- James LM, Georgopoulos AP. Immunogenetic Epidemiology of Multiple Sclerosis in 14 Continental Western European Countries. J Immunological Sci. 2021; 5(2): 40-46
- Global Burden of Disease Collaborative Network. Global Burden of Disease Study 2016 (GBD 2016) Results. Seattle, United States: Institute for Health Metrics and Evaluation (IHME), 2020. Available from http://ghdx.healthdata.org/gbd-results-tool. Data queried April 11, 2021.
- Population Reference Bureau. 2016 world population data sheet with a special focus on human needs and sustainable resources. Population Reference Bureau, Washington, DC, 2016. https://www. prb.org/2016−world−population−data−sheet/. Accessed February 5, 2019.
- Gonzalez−Galarza FF, Christmas S, Middleton D, et al. Allele frequency net: a database and online repository for immune gene frequencies in worldwide populations. Nucleic Acid Res. 2011; 39: D913–D919.
- Allele*Frequencies in Worldwide Populations [Internet]. Allele frequency net database (AFND) 2020 update. Liverpool, UK. Available from: http://allelefrequencies.net/hla6006a.asp
- Fisher RA. Statistical Methods for Research Workers. 13th ed. Edinburgh, Scotland: Oliver & Boyd; 1958.
- Coppieters KT, Wiberg A, von Herrath MG. Viral infections and molecular mimicry in type 1 diabetes. APMIS. 2012; 120(12): 941-9.
- Garamszegi LZ. Global distribution of malaria−resistant MHC−HLA alleles: the number and frequencies of alleles and malaria risk. Malar J. 2014; 13: 349.
- Singh R, Kaul R, Kaul A, et al. A comparative review of HLA associations with hepatitis B and C viral infections across global populations. World J Gastroenterol. 2007; 13(12): 1770−87.
- De Lusignan S, Khunti K, Belsey J, et al. A method of identifying and correcting miscoding, misclassification and misdiagnosis in diabetes: a pilot and validation study of routinely collected data. Diabetic Medicine. 2010; 27(2): 203-9.
- Polychronakos C, Li Q. Understanding type 1 diabetes through genetics: advances and prospects. Nat Rev Genet, 2011; 12: 781–792.