
New dimensions in intravital multi-photon imaging of immune reactions
Asylkhan Rakhymzhan1*, Randall L. Lindquist1*, Anja E. Hauser1,2#, Raluca Niesner1#
Abstract
In the last two decades intravital multi-photon imaging has become a central tool to investigate cellular and molecular dynamics of immune reactions in vivo. Currently, challenges in exploiting the full power of this technology include limitations on the number of simultaneously detectable parameters as well as in expanding the acquisition in time and space. Here we discuss technological advancements developed in order to overcome these challenges and focus on the example of germinal center reactions as multi-parametric immunological processes evolving over a time course of days and weeks.
Introduction
Over one hundred and thirty years ago, 1892, Ilya Metchnikoff put starfish larvae under a microscope, pricked them with thorns to introduce foreign material, and observed cells accumulating at these sites. Looking more closely, he noticed material was accumulating inside the cells, and he termed this phagocytosis. This is generally accepted as the foundation of cellular immunology. A century later, it is now clear that humoral immunity also involves complicated interactions between many cellular partners.
Although we know vastly more about the mechanisms by which immune responses develop, some of the basic questions remain the same. How do the cells interact with each other in living tissues? What are the functional effects of these interactions on the various cellular components? How do all of these processes evolve over time, and lead to productive - or failed - immune responses? How do pathogens and malignancies seek to manipulate these processes? How do they differ among tissues? To understand all of these processes in vivo necessarily starts with observing them-. As these processes are affected by factors such as temperature, relative cell frequency, anatomical positioning of cells relative to each other, oxygen tension, and the concentration of various host- and pathogen-derived signaling molecules and metabolites, among countless other factors, a comprehensive picture is only obtained in living tissue. This is especially true of the germinal center reaction, which is responsible for generating high-affinity antibodies necessary for effective humoral immunity.
Germinal center reactions
After infection, B cells produce antibodies to neutralize and opsonize pathogens. Interestingly, over time, the affinity of these antibodies for their target antigen increases1, a process known as affinity maturation. This has been shown to be due to repeated rounds of somatic hypermutation and affinity-based selection occurring in a specialized region of secondary lymphoid organs, called the germinal center (GC) and illustrated in Figure 12-4. The germinal center itself is divided into two zones that are each responsible for one of the above functions: to a first approximation, GC B cell division occurs in the dark zone, and affinity-based selection occurs in the light zone5-8.
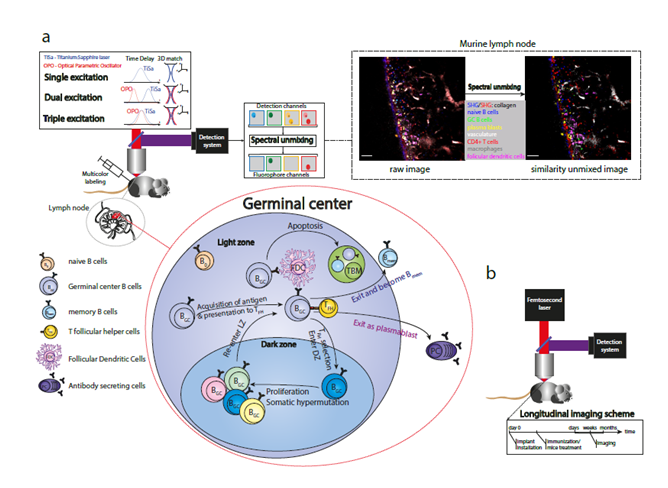
Figure 1: Expanding intravital microscopy towards multiplexed, longitudinal analysis. a) Multiplex in vivo imaging to analyze germinal centers in the murine lymph node. Three main elements of the multiplex imaging are: optimized laser excitation (single, dual or triple), multicolor labeling of different immune cell types and post-processing of multi-fluorophore images using spectral unmixing methods. Raw merged image: channel 466±20 nm - blue, channel 525±25 nm – green, channel 562±20 nm – yellow, channel 617±35 nm – red, channel 655±20 nm – gray, channel 720±20 nm – magenta. Similarity merged image: naive B cells – blue, plasma blasts – yellow, germinal center B1-8 cells – green, CD4+ T cells – red, blood vessels – light grey, follicular dendritic cells – magenta, tingible body macrophages - grey. Scale bar, 50 μm. b) Longitudinal intravital imaging of murine tissues. Longitudinal studies allow monitoring of cells repeatedly in the same regions over months.
After B cells recognize their antigen through their B cell receptor (BCR) a fraction of activated B cells relocate to the interfollicular zone, where they present antigenic peptides on MHC II to T helper (Th) cells9-12. Upon recognition of cognate antigen on an activated B cell, the T cell signals to the B cell through several signaling pathways (B7, CD40-CD40L, etc.) leading the activated B cell to proliferate; further successful antigen presentation and T follicular helper (TFH) cell signaling licenses the activated B cell to become a GC B cell and migrate to the GC in the center of the B cell follicle13-15.
Intravital imaging has demonstrated that GC reactions are highly dynamic and involve the ineractions of multiple cells types16-18. The GC reaction starts with the uptake of antigen by the B cell receptors of GC B cells from other, lower-affinity B cells19,20 or from an extensive network of specialized stromal cells called follicular dendritic cells, which retain antigen in the form of immune complexes on their surface for months21,22. After GC B cells have taken up antigen with their BCR, the antigen is internalized and degraded via the proteasome, and peptides are presented on their major histocompatibility complex (MHC) II. If the presented antigen is recognized by a cognate TFH cell, the TFH cell signals to the GC B cell through several pathways (CD40-CD40L; ICOS-ICOS-L, SLAM, etc.), licensing the GC B cell to engage the dark zone gene program and divide. The dark zone program is also responsible for somatic hypermutation, by inducing the cytosine deaminase AID, which deaminates cytosine to uracil at heavily transcribed loci, especially the Ig locus23,24 ; repair of this by uracil-N-glycosylase and error-prone DNA repair introduces further mutations25,26. The newly mutated BCRs are expressed on the surface of the GC B cell, where these B cells will compete for antigen against the remaining GC B cells. Significant evidence indicates that the limiting factor in the GC reaction is T cell help27-29. To ensure that the presented antigens are representative of the presently-encoded BCR and not retained peptide:MHC from previous “versions” of the BCR, surface peptide:MHC complexes are degraded at late stages of the dark zone program, prior to re-entry into the light zone30. Many repeated rounds of antibody diversification and affinity-based selection lead over time to dramatic improvements in antibody affinities and pathogen neutralizing abilities. GC B cells that do not receive TFH signals die by apoptosis and are rapidly phagocytosed by tingible body macrophages31. Cells exit the germinal center either as memory B cells, or as plasma blasts32,33.
Tools for intravital multi-photon imaging of immune responses
The methods used to visualize immune reactions have certain limitations which restricts the questions that can be experimentally answered. For instance, to visualize processes with cellular resolution requires three-dimensional microscopic fluorescence imaging, with a time resolution sufficient to capture migrating cells. To image deep within tissue while minimizing toxicity requires expensive pulsed lasers for two-photon excitation. Upon activation of lymphocytes, they rapidly undergo several cell divisions. If the cells are labeled with a fluorescent dye, it will be rapidly diluted out within a few days. This means that to be identified more than a few days after transfer, cells must be labeled with a genetically encoded fluorophore.
Almost all of the genetically encoded fluorophores presently in use are derived from jellyfish (Aequorea victoria) or various corals (Discoma sp, Entacmacea quadricolor)34,35. These proteins native to aquatic invertebrates did not evolve to maximize their molecular brightness or photostability upon laser illumination in mammalian tissue, and thus all of the useful genetically encoded fluorophores have required much in vitro selection and optimization to make them more useful. Further, all of these fluorophores are restricted to a small fraction of the available optical spectrum, from 400 to 660 nm. Unfortunately, the visible spectrum in which the fluorescent proteins fall is suboptimal for imaging, as shorter wavelengths are scattered more. Increasing the emitted wavelength to the near-infrared leads to a dramatic decrease of scattering, hence, permitting more sensitive imaging much deeper in tissue. Recently, there has been progress in developing near-infrared fluorescent proteins derived from various bacterial phytochromes, but these are still at a relatively immature state of development regarding brightness, photostability and the in vivo availability of necessary cofactor, compared to the visible fluorescent proteins36. To identify multiple cell types - as in the germinal center, which contains GC B cells, recirculating naive and memory B cells, and Tfh cells, among others (Figure 1) - requires each to be unambiguously labeled with a genetically encoded fluorescent reporter. Hence, a broad palette of fluorescent proteins is required spanning a large range of emission wavelengths, which in turn generates its own technological challenges, as discussed in the following section.
To understand the cellular and molecular diversity of the immune system represents one of the fundamental challenges for modern imaging techniques37. In this respect, intravital two-photon microscopy, being the leading method to monitor cellular and molecular dynamics in genuine tissue environment, is still limited with respect to multiplex detection and simultaneous visualization of many diverse cellular players of immune processes, i.e. maximally four parameters. There are three main elements of multiplex simultaneous detection in vivo: a broad palette of fluorescent markers (synthetic dyes or fluorescent proteins), optimized excitation laser sources and, finally, effective spectral unmixing (Figure 1a)38. The choice of fluorescent markers depends on scientific questions34 but the more markers are multiplexed to label cells, the more information can be simultaneously extracted from one experiment. The development of new fluorophores expands rapidly towards the near-IR/IR range allowing deeper tissue imaging and higher quantity of multiplexing36,39,40. Various excitation schemes were used to detect multiple cellular markers in different organs and tissues. Characterization of six cellular components was illustrated by using sequential single laser excitation in a brain glioblastoma tumor of triple transgenic mice41. The effect of dual near-IR/IR excitation was shown by imaging three fluorescent proteins in the brain stem of transgenic mice42, and five cellular signals were detected within an exogenously grown tumor in immunodeficient mice43. The dual two-photon excitation is achieved by matching foci volumes of both near-IR and IR laser in space. Hence, the molecules within the sample can be excited either with two near-IR or with two IR photons. The power of triple two-photon excitation was demonstrated to intravitally visualize three chromophores and second harmonic generation (SHG) in fly embryos44, and seven fluorophores in distinct cellular and tissue compartment in murine lymph nodes38. The triple two-photon excitation scheme is based on a wavelength mixing technique45,46, which implies temporal synchronization of pulse trains from two lasers with the same repetition rate as well as spatial overlap of their foci volumes (Figure 1a). The SHG can be detected from a tissue with ordered structure, i.e. collagen fibers, where the emitting photons have twice the energy of the initial photons. The triple excitation scheme allows simultaneous imaging of more fluorophores with broader spectral range as compared to the single and dual excitations. Although the broad palette of chromophores can be visualized by the optimized excitation scheme, the identification of different cell types is still hindered by the spectral overlap of fluorophores emitting at similar wavelengths. For this reason, spectral unmixing is vital for unambiguous discrimination of multiple fluorophores. Among all methods, linear unmixing is a classical and widely used method, which is implemented in commercial as well as in open-source software (Fiji/ImageJ PlugIn of J. Walter). However, because of its analytical nature, the linear method does not allow the separation of more fluorophores than there are detection channels47,48. As an alternative, similarity (SIMI) unmixing represents a powerful algorithm, where color separation is performed based on the similarity of mixed fluorophores with spectral signatures of known chromophores38. Moreover, SIMI can be used as a complementary tool to linear unmixing, because it is not limited by the linear unmixing condition between the number of fluorophores and the amount of detection channels.
Imaging clonality
As depicted above in Figure 1, the germinal center reaction generates high-affinity antibodies by repeated rounds of diversification and affinity-based selection. Several clever combinatorial methods have been developed to label cells with different combinations of fluorescent proteins, enabling closely apposed cells and cellular processes to be distinguished49. This has been used to follow the clonality of germinal centers, revealing that anatomically nearby germinal centers within one lymph node may have very different compositions and be clonally independent of each other50. To distinguish multiple clonal variants of B cell, in addition to antigen-specific Tfh cells and wild-type control B cells, requires an unmixing algorithm like the one described above (Figure 1a).
Imaging tissue and cellular function
When techniques for intravital imaging were first developed, there were relatively few fluorescent reporters of protein function, limiting the observations to quantifications of cellular movement and interactions. One promising technology that can provide a link from cellular dynamics to cellular function is Förster Resonance Energy Transfer (FRET). This technology uses the phenomenon of non-radiative (via dipole-dipole interaction) energy transfer that converts the excitation from a fluorophore serving as a donor to the fluorescence of another chromophore or acceptor in the range of 1-10 nm. Based on FRET technology many methods have been developed using different relationships of donor-acceptor intensities, excited state lifetimes, and emission anisotropy. The methods based on intensity relationships require an accurate reference for acceptor-free donor signals and correction for spectral overlapping of donor and acceptor signals. The techniques based on determination of fluorescence lifetimes are one of the most direct ways to quantify FRET, allowing to avoid effects of photobleaching and differences in signal-to-noise-ratio of donor and acceptor molecules51. Emission anisotropy measured at different polarized excitation provides information of rotational diffusion being sensitive to size, shape, orientation and motion of the molecules. A bright illustration of intravital application of FRET technology has been shown using Ca2+ imaging of brain in transgenic mice CerTN L15, which contain a troponin-C FRET-based calcium biosensor52-54. Referring to cells of the immune system, FRET-based indicators of intracellular calcium have been used to measure lymphocyte activation55. Many further reporters have been developed, indicating such parameters as voltage49, caspase-3 activity31, the concentration of molecules including H2O2, lactate, glutamate, and the location within the cell of transcription factors such as NFAT, Foxo1, or relB. To multiplex various functional reporters necessarily requires that they each use easily distinguishable fluorescent proteins.
Longitudinal intravital imaging
Although acute inflammation is detectable within seconds, with leukocytes moving on the order of one to three cell diameters per minute, immune reactions occur over a time scale of weeks. This imposes significant challenges for observational studies, as individual cells must be followed with a time resolution sufficient to follow and track the cells over time. Imaging sessions can be maintained for a period of several hours, but this is still two to three orders of magnitude too short to observe the evolution of high-affinity antibody responses. To visualize the immune response in its entirety will require methods for repeated longitudinal imaging of the same lymph node. However, this is challenging, as imaging of lymph nodes requires their surgical exposure, which is not considered a survival procedure; even if it was, the repeated surgical exposure would cause significant, prolonged, recurrent inflammation in the lymph node, confounding experimental observations. Longitudinal imaging methods have been well established for imaging of the brain56, spinal cord, orthotopic malignancies, and bone marrow57 (Reismann et al, in press), but to date there remains only one method for longitudinal imaging of lymph nodes: orthotopic transplantation to a superficial site, permitting direct observation through the skin. This method, although relatively unexplored, has the potential to vastly increase the scope of intravital imaging of immune reactions – longitudinal imaging is a prerequisite for any sort of long-term labeling or manipulation (Figure 1b).
The goal of longitudinal imaging is to follow the cells from one imaging session to another. The development of photoactivatable proteins - photoconverting a dark fluorescent state of a chromophore to a bright state in response to the light with a specific wavelength or intensity - made this possible, as cells can be individually photoactivated and observed as long as the fluorescent protein remains visible; this was used to label, isolate, and track GC light zone and dark zone cells for shorter periods of time58. However, this remains challenging, as photoactivated proteins are degraded due to normal protein turnover, and diluted out by cell divisions. The rapid division of GC B cells, with a cell cycle time of 6-12 hours16, makes GC cells impossible to track for longer than a day or two using directly photoactivatable fluorescent proteins.
The recent development of methods for optical induction of genetic changes, such as photoactivatable Cre recombinase59-61 will make it easier to irreversibly label imaged cells and their progeny, permitting the daughter cells to be tracked over the course of weeks. This too is still a work in progress, with the necessary tools still being optimized for the available imaging and activation methods; the longitudinal imaging necessary for such long-term tracking is itself still under development.
Outlook: optical manipulation
The development of optically activatable systems has enabled microscopy to switch from a purely observational method to one capable of experimental manipulations. The above-mentioned systems for optical activation of Cre recombination should permit the deletion or activation of any arbitrary gene program in an optically targeted population of cells59-61. Similar systems have been generated to optically induce or silence transcription at a given genetic locus, if reversible changes are sought59-61,62,63. When longitudinal imaging of lymph nodes is fully integrated with optical methods for labeling and manipulating cells, this will enable immunologists to fully use the optogenetic tools exploited so productively by neuroscientists over the last ten years.
Acknowledgments
We thank the Deutsche Forschungsgemeinschaft (DFG) for financial support under grant TRR130, P17 to A.E.H. and C01 to R.A.N. and A.E.H., under grant FOR2165/2 to R.A.N. (NI1167/4-2) and A.E.H. (HA5354/6-2) and under grant Exc257, NeuroCure to A.E.H.
References
- Eisen HN, Siskind GW. Variations in Affinities of Antibodies during the Immune Response. Biochemistry. 1964; 3: 996-1008.
- Berek C, Berger A, Apel M. Maturation of the immune response in germinal centers. Cell. 1991; 67; 1121-1129.
- Takahashi Y, Dutta PR, Cerasoli DM, et al. In situ studies of the primary immune response to (4-hydroxy-3-nitrophenyl)acetyl. V. Affinity maturation develops in two stages of clonal selection. J Exp Med. 1998; 187: 885-895.
- Jacob RA, Kelley DS, Pianalto FS, et al. Immunocompetence and oxidant defense during ascorbate depletion of healthy men. Am J Clin Nutr. 1991; 54: 1302S-1309S.
- MacLennan IC. Germinal centers. Annu Rev Immunol. 1994; 12: 117-139. doi:10.1146/annurev.iy.12.040194.001001.
- Victora GD, Nussenzweig MC. Germinal centers. Annu Rev Immunol. 2012; 30: 429-457. doi:10.1146/annurev-immunol-020711-075032.
- Vinuesa CG, Linterman MA, Yu D, et al. Follicular Helper T Cells. Annu Rev Immunol. 2016; 34: 335-368, doi:10.1146/annurev-immunol-041015-055605.
- Bannard O, Cyster JG. Germinal centers: programmed for affinity maturation and antibody diversification. Curr Opin Immunol. 2017; 45: 21-30. doi:10.1016/j.coi.2016.12.004.
- Kerfoot SM, Yaari G, Patel JR, et al. Germinal center B cell and T follicular helper cell development initiates in the interfollicular zone. Immunity. 2011; 34: 947-960. doi:10.1016/j.immuni.2011.03.024.
- Lanzavecchia A. Antigen-specific interaction between T and B cells. Nature. 1985; 314: 537-539.
- Garside P, Ingulli E, Merica RR, et al. Visualization of specific B and T lymphocyte interactions in the lymph node. Science. 1998; 281: 96-99.
- Pape KA, Kouskoff V, Nemazee D, et al. Visualization of the genesis and fate of isotype-switched B cells during a primary immune response. J Exp Med. 2003; 197: 1677-1687. doi:10.1084/jem.20012065.
- Kupfer H, Monks CR, Kupfer A. Small splenic B cells that bind to antigen-specific T helper (Th) cells and face the site of cytokine production in the Th cells selectively proliferate: immunofluorescence microscopic studies of Th-B antigen-presenting cell interactions. J Exp Med. 1994; 179: 1507-1515.
- Clark E, Cirvilleri G. Cloning cassettes containing the reporter gene xylE. Gene. 1994; 151: 329-330.
- Watanabe M, Fujihara C, Radtke AJ, et al. Co-stimulatory function in primary germinal center responses: CD40 and B7 are required on distinct antigen-presenting cells. J Exp Med. 2017; 214: 2795-2810. doi:10.1084/jem.20161955.
- Hauser AE, Junt T, Mempel TR, et al. Definition of germinal-center B cell migration in vivo reveals predominant intrazonal circulation patterns. Immunity. 2007; 26: 655-667. doi:S1074-7613(07)00252-X [pii] 10.1016/j.immuni.2007.04.008.
- Schwickert TA, Lindquist RL, Shakhar G, et al. In vivo imaging of germinal centres reveals a dynamic open structure. Nature. 2007; 446: 83-87. doi:10.1038/nature05573.
- Cyster JG. Chemokines and cell migration in secondary lymphoid organs. Science. 1999; 286: 2098-2102.
- Lanzavecchia A. Antigen uptake and accumulation in antigen-specific B cells. Immunol. 1987; Rev 99: 39-51.
- Nowosad CR, Spillane KM, Tolar P. Germinal center B cells recognize antigen through a specialized immune synapse architecture. Nat Immunol. 2016; 17: 870-877. doi:10.1038/ni.3458.
- Mandel TE, Phipps RP, Abbot A, et al. The follicular dendritic cell: long term antigen retention during immunity. Immunol Rev. 1980; 53: 29-59.
- Heesters BA, Myers RC, Carroll MC. Follicular dendritic cells: dynamic antigen libraries. Nat Rev Immunol. 2014; 14: 495-504. doi:10.1038/nri3689.
- Ramiro AR, Stavropoulos P, Jankovic M, et al. Transcription enhances AID-mediated cytidine deamination by exposing single-stranded DNA on the nontemplate strand. Nat Immunol. 2003; 4: 452-456. doi:10.1038/ni920.
- Yoshikawa K, Okazaki IM, Eto T, et al. AID enzyme-induced hypermutation in an actively transcribed gene in fibroblasts. Science. 2002; 296: 2033-2036. doi:10.1126/science.1071556 (2002).
- Li Y, Zeng J, Liu L, et al. [GC-MS analysis of supercritical carbon dioxide extraction products from pericarp of Zanthoxylum bungeanum]. Zhong Yao Cai. 2001; 24: 572-573.
- Imai K, Hanaoka K, Mine T. Zonal differences in effects of HGF/SF and EGF on DNA synthesis in hepatocytes at different times post-hepatectomy. Hepatol Res. 2003; 27: 302-308.
- Shulman Z, Gitlin AD, Weinstein JS, et al. Dynamic signaling by T follicular helper cells during germinal center B cell selection. Science. 2014; 345: 1058-1062. doi:10.1126/science.1257861.
- Gitlin AD, Shulman Z, Nussenzweig MC. Clonal selection in the germinal centre by regulated proliferation and hypermutation. Nature. 2014; 509: 637-640. doi:10.1038/nature13300.
- Gitlin AD, Mayer CT, Oliveira TY, et al. HUMORAL IMMUNITY. T cell help controls the speed of the cell cycle in germinal center B cells. Science. 2015; 349: 643-646. doi:10.1126/science.aac4919.
- Bannard O, McGowan SJ, Ersching J, et al. Ubiquitin-mediated fluctuations in MHC class II facilitate efficient germinal center B cell responses. J Exp Med. 2016; 213: 993-1009. doi:10.1084/jem.20151682.
- Mayer CT, Gazumyan A, Kara EE, et al. The microanatomic segregation of selection by apoptosis in the germinal center. Science. 2017; 358: doi:10.1126/science.aao2602.
- Roth K, Oehme L, Zehentmeier S, et al. Tracking plasma cell differentiation and survival. Cytometry A. 2014; 85: 15-24. doi:10.1002/cyto.a.22355.
- Ulbricht C, Lindquist RL, Tech L, et al. Tracking Plasma Cell Differentiation in Living Mice with Two-Photon Microscopy. Methods Mol Biol. 2017; 1623: 37-50. doi:10.1007/978-1-4939-7095-7_3.
- Shaner NC, Steinbach PA, Tsien RY. A guide to choosing fluorescent proteins. Nat Methods. 2005; 2: 905-909. doi:10.1038/nmeth819.
- Rodriguez EA, Tran GN, Gross LA, et al. A far-red fluorescent protein evolved from a cyanobacterial phycobiliprotein. Nat Methods. 2016; 13: 763-769. doi:10.1038/nmeth.3935.
- Shcherbakova DM, Baloban M, Pletnev S, et al. Molecular Basis of Spectral Diversity in Near-Infrared Phytochrome-Based Fluorescent Proteins. Chem Biol. 2015; 22: 1540-1551. doi:10.1016/j.chembiol.2015.10.007.
- Tang J, van Panhuys N, Kastenmuller W, et al. The future of immunoimaging--deeper, bigger, more precise, and definitively more colorful. Eur J Immunol. 2013; 43: 1407-1412. doi:10.1002/eji.201243119.
- Rakhymzhan A. Leben R, Zimmermann H, et al. Synergistic Strategy for Multicolor Two-photon Microscopy: Application to the Analysis of Germinal Center Reactions In Vivo. Sci Rep. 2017; 7: 7101. doi:10.1038/s41598-017-07165-0.
- Hilderbrand SA, Weissleder R. Near-infrared fluorescence: application to in vivo molecular imaging. Curr Opin Chem Biol. 2010; 14: 71-79. doi:10.1016/j.cbpa.2009.09.029.
- Shcherbo D. Near-infrared fluorescent proteins. Nat Methods. 2010; 7: 827-829. doi:10.1038/nmeth.1501.
- Ricard C, Debarbieux FC. Six-color intravital two-photon imaging of brain tumors and their dynamic microenvironment. Front Cell Neurosci. 2014; 8: 57. doi:10.3389/fncel.2014.00057.
- Herz J, Siffrin V, Hauser AE, et al. Expanding two-photon intravital microscopy to the infrared by means of optical parametric oscillator. Biophys J. 2010; 98: 715-723. doi:S0006-3495(09)01677-4 [pii] 10.1016/j.bpj.2009.10.035.
- Entenberg D, Wyckoff J, Gligorijevic B, et al. Setup and use of a two-laser multiphoton microscope for multichannel intravital fluorescence imaging. Nat Protoc. 2011; 6: 1500-1520. doi:10.1038/nprot.2011.376.
- Mahou P, Zimmerley M, Loulier K, et al. Multicolor two-photon tissue imaging by wavelength mixing. Nat Methods. 2012; 9: 815-818, doi:10.1038/nmeth.2098.
- Lakowicz JR, Gryczynski I, Malak H, et al. Two-color two-photon excitation of fluorescence. Photochem Photobiol. 1996; 64: 632-635.
- Quentmeier S, Denicke S, Gericke KH. Two-color two-photon fluorescence laser scanning microscopy. J Fluoresc. 2009; 19: 1037-1043. doi:10.1007/s10895-009-0503-x.
- Zimmermann T, Rietdorf J, Girod A, et al. Spectral imaging and linear un-mixing enables improved FRET efficiency with a novel GFP2-YFP FRET pair. FEBS Lett. 2002; 531: 245-249.
- Neher R, Neher E. Optimizing imaging parameters for the separation of multiple labels in a fluorescence image. J Microsc. 2004; 213: 46-62.
- Livet J, Weissman TA, Kang H, et al. Transgenic strategies for combinatorial expression of fluorescent proteins in the nervous system. Nature. 2007; 450, 56-62. doi:10.1038/nature06293.
- Tas JM, Mesin L, Pasqual G, et al. Visualizing antibody affinity maturation in germinal centers. Science. 2016; 351: 1048-1054. doi:10.1126/science.aad3439.
- Rakymzhan A, Radbruch H, Niesner RA. Quantitative Imaging of Ca2+ by 3D-FLIM in Live Tissues. Adv Exp Med Biol. 2017; 1035: 135-141. doi:10.1007/978-3-319-67358-5_9.
- Radbruch H, Bremer D, Mothes R, et al. Intravital FRET: Probing Cellular and Tissue Function in Vivo. Int J Mol Sci. 2015; 16: 11713-11727. doi:10.3390/ijms160511713.
- Mossakowski AA. Pohlan J, Bremer D, et al. Tracking CNS and systemic sources of oxidative stress during the course of chronic neuroinflammation. Acta Neuropathol. 2015; 130: 799-814. doi:10.1007/s00401-015-1497-x.
- Radbruch H, Bremer D, Guenther R, et al. Ongoing Oxidative Stress Causes Subclinical Neuronal Dysfunction in the Recovery Phase of EAE. Front Immunol. 2016; 7: 92. doi:10.3389/fimmu.2016.00092.
- Yoshikawa S, Usami T, Kikuta J, et al. Intravital imaging of Ca(2+) signals in lymphocytes of Ca(2+) biosensor transgenic mice: indication of autoimmune diseases before the pathological onset. Sci Rep. 2016; 6: 18738, doi:10.1038/srep18738.
- Barretto RP, Ko TH, Jung JC, et al. Time-lapse imaging of disease progression in deep brain areas using fluorescence microendoscopy. Nat Med. 2011; 17: 223-228. doi:nm.2292 [pii] 10.1038/nm.2292.
- Hawkins ED, Duarte D, Akinduro O, et al. T-cell acute leukaemia exhibits dynamic interactions with bone marrow microenvironments. Nature. 2016; 538: 518-522. doi:10.1038/nature19801.
- Victora GD, Schwickert TA, Fooksman DR, et al. Germinal center dynamics revealed by multiphoton microscopy with a photoactivatable fluorescent reporter. Cell. 2010; 143: 592-605. doi:10.1016/j.cell.2010.10.032.
- Kennedy MJ, Hughes RM, Peteya LA, et al. Rapid blue-light-mediated induction of protein interactions in living cells. Nat Methods. 2010; 7: 973-975. doi:10.1038/nmeth.1524.
- Kaberniuk AA, Shemetov AA, Verkhusha VVA bacterial phytochrome-based optogenetic system controllable with near-infrared light. Nat Methods. 2016; 13: 591-597. doi:10.1038/nmeth.3864.
- Zhang W, Lohman AW, Zhuravlova Y, et al. Optogenetic control with a photocleavable protein, PhoCl. Nat Methods. 2017; 14: 391-394. doi:10.1038/nmeth.4222.
- Konermann S, Brigham MD, Trevino A, et al. Optical control of mammalian endogenous transcription and epigenetic states. Nature. 2013; 500: 472-476. doi:10.1038/nature12466.
- Polstein LR Gersbach CA. A light-inducible CRISPR-Cas9 system for control of endogenous gene activation. Nat Chem Biol. 2015; 11: 198-200. doi:10.1038/nchembio.1753.