
Immunogenetic Epidemiology of Multiple Sclerosis in 14 Continental Western European Countries
Lisa M. James1,2,3, Apostolos P. Georgopoulos1,2,3,4*
1The HLA Research Group, Brain Sciences Center, Department of Veterans Affairs Health Care System, Minneapolis, MN, 55417, USA
2Department of Neuroscience, University of Minnesota Medical School, Minneapolis, MN 55455, USA
3Department of Psychiatry, University of Minnesota Medical School, Minneapolis, MN 55455, USA
4Department of Neurology, University of Minnesota Medical School, Minneapolis, MN 55455, USA
Abstract
Human leukocyte antigen (HLA), a system involved in immune response to foreign antigens and in autoimmunity, has been strongly implicated in multiple sclerosis (MS). Prior research has shown that HLA DRB1*15:01 exerts the strongest susceptibility effect, although other HLA alleles have been implicated in both susceptibility to, and protection against, MS. Here we utilized an immunogenetic epidemiological approach to evaluate correlations between the population frequencies of 127 HLA Class I and II alleles and the population prevalence of MS in 14 Continental Western European countries to identify an HLA profile for MS. The results of these analyses, which largely corroborated prior findings and revealed several novel and highly robust HLA associations with MS, revealed a larger number of protective HLA alleles than susceptibility alleles, particularly for HLA Class I. Given the role of HLA in pathogen elimination and autoimmunity, these findings point to a contributory role of exposure to pathogens in the absence of protective HLA in underlying the inflammation and autoimmunity associated with MS.
Introduction
Multiple sclerosis (MS), a chronic autoimmune inflammatory disease of the central nervous system, is the most common neurological disorder in young adults. According to recent estimates1, 2.8 million people globally are living with MS, and the global prevalence is increasing1,2. Pathologically, MS is characterized by multifocal demyelinating lesions, axonal loss, atrophy, and perivascular inflammatory infiltrates3. Symptoms of MS vary tremendously and can include problems with mobility, hand function, vision, fatigue, cognition, bowel/bladder function, sensory, spasticity, pain, depression, and tremor/coordination4. Although the course is variable, the vast majority of MS patients have a relapsing-remitting form of the disease5. A specific cause has not been identified; however, there is strong evidence that exposure to pathogens such as the Epstein-Barr virus may influence risk of MS, suggesting a potential role of viral influence in addition to the more traditional views of MS as an autoimmune disorder or as an inflammatory disease that may give way to neurodegeneration at advanced stages6,7. Additional lifestyle and environmental factors such as smoking, sun exposure/vitamin D, and adolescent obesity also appear to play a role in MS susceptibility8,9. Finally, there is considerable geographic variation in MS prevalence6. It has been well-established that a latitudinal gradient exists for MS10, leading researchers to speculate that environmental factors that vary with latitude such as ultraviolet radiation or vitamin D are associated with the increasing disease prevalence at higher latitudes; however, anomalies in the general latitudinal gradient, particular for indigenous populations, suggest the influence of additional factors that influence population susceptibility to MS6,10.
A system that varies by population, is involved with pathogen elimination (e.g., Epstein-Barr virus) and autoimmunity, and has been strongly implicated in MS is Human Leukocyte Antigen (HLA). HLA genes code for cell-surface proteins that facilitate immune system responses aimed at elimination of foreign antigens. HLA Class I molecules (HLA-A, -B, -C) present intracellular antigen peptides to CD8+ cytotoxic T cells to signal destruction of infected cells. HLA Class II molecules (HLA-DR, DQ, and DP genes) present endocytosed extracellular antigen peptides to CD4+ T cells to promote B-cell mediated antibody production and adaptive immunity. Thus, HLA confers protection via pathogen elimination; consequently, HLA has evolved in concert with pathogen evolution11,12 and has been shown to vary by population13,14, presumably reflecting differences in pathogen exposure. In fact, HLA is the most highly polymorphic region of the human genome, thereby maximizing species resistance to foreign antigens. However, a breakdown in this process – for instance, an inability of the immune system to distinguish self from non-self antigens – can result in autoimmunity15. Strong evidence suggests that MS is an autoimmune disease directed against myelin or other CNS antigens16. Class II HLA genes account for 10.5% of the genetic variance underlying risk for MS with HLA DRB1*15:01 exerting the strongest effect, although additional alleles, varying across populations, have been inconsistently implicated in MS17-21. With regard to immunogenetic protection, the most consistent protective effects have been reported for Class I HLA-A*02:01, although in European Populations DRB1*14:01 has also been shown to be highly protective17. Moreover, environmental factors that have been implicated in MS susceptibility have been shown to interact with HLA to influence risk8,9.
As noted elsewhere17, a limitation of many of the HLA associations identified in MS, with the exception of DRB1*15:01, is that they have been detected through imputation rather than direct HLA sequencing. While more time- and cost-effective than direct sequencing, the accuracy of HLA imputation for certain alleles (e.g., DRB1) has been reported to be as low as 30%22. Conversely, due to the highly polymorphic nature of HLA, direct sequencing of large enough samples to identify HLA-disease associations is often prohibitive. Here we take an alternative immunogenetic epidemiology approach that takes advantage of the population heterogeneity of HLA and permits identification of a high-resolution population level HLA profile with regard to disease prevalence. Using this approach, we23-26 and others13 have identified HLA alleles that are negatively associated with disease prevalence (i.e., protective alleles) as well as HLA alleles that are positively associated with disease prevalence (i.e., susceptibility alleles). In light of HLA’s involvement in pathogen elimination and autoimmunity, we presume that protective alleles facilitate pathogen elimination and that susceptibility alleles promote autoimmunity. Here, we extend that line of research to identify an HLA profile for MS in Continental Western Europe using population-level immunogenetic data and MS prevalences estimated from the 2016 Global Burden of Disease study, the most comprehensive global study of disease morbidity, mortality, and associated risk factors. Though studies at the individual or cohort level permit more direct investigation of MS pathogenesis and factors that affect MS disease course and treatment response27-29, immunogenetic epidemiological approaches such as ours are beneficial for understanding immunogenetic contributions to population-level disease variability.
Materials and Methods
Prevalence of MS
The population prevalence of MS was computed for each of the following 14 countries in Continental Western Europe: Austria, Belgium, Denmark, Finland, France, Germany, Greece, Italy, Netherlands, Portugal, Norway, Spain, Sweden, and Switzerland. Specifically, the total number of people with MS in each of the 14 Continental Western European countries as determined by the Global Burden of Disease study2, which utilizes rigorous, standardized approaches to estimate country-specific data from multiple sources, was divided by the total population of each country in 2016 (Population Reference Bureau)30 and expressed as a percentage. We have previously shown that life expectancy for these countries are virtually identical; therefore, life expectancy was not included in the current analyses.
HLA
The frequencies of all reported HLA alleles of classical genes of Class I (A, B, C) and Class II (DPB1, DQB1, DRB1) for each of the 14 Continental Western European countries were retrieved from the website allelefrequencies.net (Estimation of Global Allele Frequencies31,32) on October 20, 2020. There was a total of 2746 entries of alleles from the 14 Continental Western European countries, comprising 844 distinct alleles. Of those, 127 alleles occurred in 9 or more countries and were used in further analyses. The distribution of those alleles to the HLA classes and their genes is given in Table 1.
Table 1: Distribution of 127 HLA alleles analyzed to Class and Genes.
|
|
Class I (N = 69) |
Class II (N = 58) |
||||
|
Gene |
A |
B |
C |
DPB1 |
DQB1 |
DRB1 |
|
Count |
20 |
36 |
13 |
15 |
14 |
29 |
Data analysis
HLA profiles for MS were derived as described previously for Parkinson’s disease and dementia26. Briefly, the prevalence of MS in a country was computed as the fraction of total country population and was expressed as a percentage. MS prevalences were natural-log transformed23-26 and the Pearson correlation coefficient, r, between MS prevalence and the population frequency of each one of the 127 HLA alleles above calculated and Fisher z−transformed33 to normalize its distribution:
r´ = atanh(r) (1)
The MS HLA profile consisted of 127 values of r´. The effects of HLA Class and gene (within a class) on r´ were evaluated using a univariate analysis of variance (ANOVA). Finally, differences in the proportions of the counts of negative and positive r´ were evaluated using the Wald H0 statistic for comparing proportions of independent samples. Statistical analyses were performed using the IBM−SPSS package (IBM SPSS Statistics for Windows, Version 26.0, 64−bit edition. Armonk, NY: IBM Corp; 2019) and Intel FORTRAN (Microsoft Visual Studio Community Version 16.8.3; Intel FORTRAN Compiler 2021).
Results
As mentioned above, the MS HLA profile consists of correlations between allele frequency and disease prevalence, suitably Fisher z-transformed (Equation 1) to normalize their distribution for further analyses. We showed previously24 that dementia prevalence varies in an exponential fashion with allele frequency, such that the logarithm of disease prevalence is a linear function of allele frequency. We found the same relation here between MS prevalence and HLA allele frequency. Two examples are illustrated in Figures 1 and 2, namely for a presumed MS protective allele (DRB1*04:03) and a susceptibility allele (A*03:01) (Figures 1 and 2, respectively).
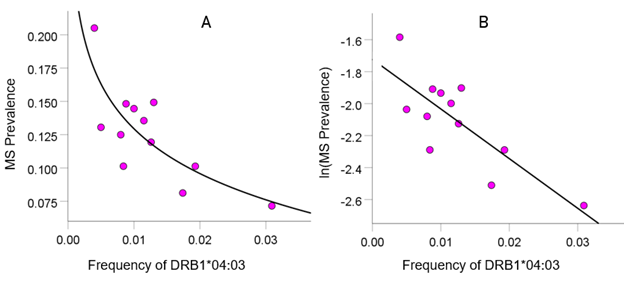
Figure 1: Example from a presumed protective HLA allele (DRB1*04:03) for MS. A, MS prevalence (%) for 12 CWE countries is plotted against the corresponding frequency of the DRB1*04:03 allele; the fitted line is a logarithmic fit. B, the same data are plotted using the natural-log transformed MS prevalence against the same allele frequency; the line is a linear fit (P = 0.002).
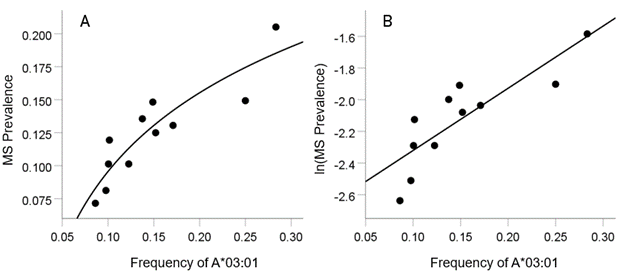
Figure 2: Example from a presumed susceptibility HLA allele (A*03:01) for MS. A, the prevalence for 11 CWE countries is plotted against the corresponding frequency of the A*03:01 allele (logarithmic fit); B, the same data are plotted using the natural-log transformed MS prevalence against the same allele frequency; the line is a linear fit (P = 0.001).
HLA-MS profile
The frequency distribution of alleles in the MS HLA profile (Table 2) is shown in Figure 3. There were 77/127 (60.6%) negative (protective) alleles and 50/127 (39.4%) positive (susceptibility) alleles. These percentages differed significantly from the null hypothesis of 50% (P = 0.017, two-sided one-sample binomial test; z = 2.396).
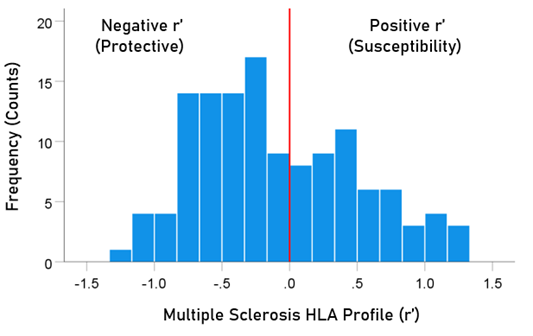
Figure 3: Frequency distribution of MS HLA profile (N = 127).
The distributions of r´ for Class I and II are shown in Figure 4. There were 69/127 (54.3%) r´ in Class I and 58/127 (46.7%) in Class II; these percentages did not differ significantly (P = 0.329, two-sided one-sample binomial test; z = 0.976). For Class I, there were 45/69 (65.2%) negative (protective) and 24/69 (34.8%) positive (susceptibility) values, respectively; these percentages differed significantly (P = 0.011, two-sided one-sample binomial test; z = 2.528). In contrast, for Class II, there were 26/58 (44.8%) negative and 32/58 (55.2%) positive values, respectively; these percentages did not differ significantly (P = 0.431, two-sided one-sample binomial test; z = 0.788).
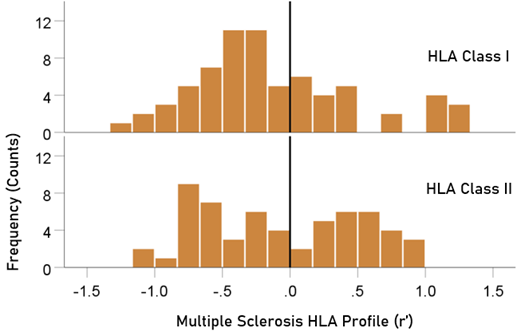
Figure 4: HLA Class distributions of MS HLA profile . N = 69 alleles for Class I and 58 alleles for Class II.
Table 2: HLA profile of MS. The signed z-transformed correlation coefficient (r´) between 127 HLA alleles and ln (MS) prevalence. N denotes the number of CWE countries from which r´ was calculated.
|
|
Allele |
Class |
N |
r´(MS) |
|
1 |
A*01:01 |
I |
11 |
−0.158 |
|
2 |
A*02:01 |
I |
11 |
0.185 |
|
3 |
A*02:05 |
I |
9 |
−0.251 |
|
4 |
A*03:01 |
I |
11 |
1.240 |
|
5 |
A*11:01 |
I |
11 |
−0.941 |
|
6 |
A*23:01 |
I |
11 |
−0.731 |
|
7 |
A*24:02 |
I |
11 |
0.324 |
|
8 |
A*25:01 |
I |
12 |
0.299 |
|
9 |
A*26:01 |
I |
11 |
−0.637 |
|
10 |
A*29:01 |
I |
11 |
0.077 |
|
11 |
A*29:02 |
I |
11 |
−0.355 |
|
12 |
A*30:01 |
I |
11 |
−0.071 |
|
13 |
A*30:02 |
I |
12 |
−0.356 |
|
14 |
A*31:01 |
I |
9 |
1.216 |
|
15 |
A*32:01 |
I |
12 |
−0.968 |
|
16 |
A*33:01 |
I |
10 |
−0.292 |
|
17 |
A*33:03 |
I |
9 |
−0.548 |
|
18 |
A*36:01 |
I |
10 |
−0.335 |
|
19 |
A*68:01 |
I |
11 |
0.078 |
|
20 |
A*68:02 |
I |
10 |
0.094 |
|
21 |
B*07:02 |
I |
10 |
1.027 |
|
22 |
B*08:01 |
I |
12 |
0.344 |
|
23 |
B*13:02 |
I |
11 |
0.133 |
|
24 |
B*14:01 |
I |
11 |
−0.332 |
|
25 |
B*14:02 |
I |
10 |
−0.372 |
|
26 |
B*15:01 |
I |
10 |
1.184 |
|
27 |
B*15:17 |
I |
9 |
−0.081 |
|
28 |
B*15:18 |
I |
9 |
−0.563 |
|
29 |
B*18:01 |
I |
12 |
−1.056 |
|
30 |
B*27:02 |
I |
10 |
0.032 |
|
31 |
B*27:05 |
I |
12 |
0.776 |
|
32 |
B*35:01 |
I |
11 |
−0.068 |
|
33 |
B*35:02 |
I |
9 |
−0.265 |
|
34 |
B*35:03 |
I |
9 |
−0.603 |
|
35 |
B*35:08 |
I |
9 |
−0.831 |
|
36 |
B*37:01 |
I |
10 |
1.059 |
|
37 |
B*38:01 |
I |
9 |
−0.899 |
|
38 |
B*39:01 |
I |
11 |
−0.294 |
|
39 |
B*39:06 |
I |
9 |
−0.329 |
|
40 |
B*40:01 |
I |
12 |
1.130 |
|
41 |
B*40:02 |
I |
12 |
0.437 |
|
42 |
B*41:01 |
I |
11 |
−0.282 |
|
43 |
B*41:02 |
I |
10 |
−0.656 |
|
44 |
B*44:02 |
I |
12 |
0.065 |
|
45 |
B*44:03 |
I |
12 |
−0.396 |
|
46 |
B*44:05 |
I |
9 |
−0.752 |
|
47 |
B*45:01 |
I |
10 |
−0.316 |
|
48 |
B*47:01 |
I |
11 |
−0.214 |
|
49 |
B*49:01 |
I |
11 |
−1.008 |
|
50 |
B*50:01 |
I |
10 |
−0.420 |
|
51 |
B*51:01 |
I |
10 |
−1.260 |
|
52 |
B*52:01 |
I |
10 |
−0.485 |
|
53 |
B*55:01 |
I |
11 |
0.351 |
|
54 |
B*56:01 |
I |
9 |
0.459 |
|
55 |
B*57:01 |
I |
12 |
−0.391 |
|
56 |
B*58:01 |
I |
9 |
−0.383 |
|
57 |
C*01:02 |
I |
9 |
0.381 |
|
58 |
C*03:03 |
I |
9 |
0.709 |
|
59 |
C*04:01 |
I |
9 |
−0.501 |
|
60 |
C*05:01 |
I |
9 |
0.266 |
|
61 |
C*06:02 |
I |
9 |
−0.221 |
|
62 |
C*07:01 |
I |
9 |
−0.187 |
|
63 |
C*07:02 |
I |
9 |
1.160 |
|
64 |
C*07:04 |
I |
9 |
−0.404 |
|
65 |
C*12:02 |
I |
9 |
−0.635 |
|
66 |
C*12:03 |
I |
9 |
−0.739 |
|
67 |
C*14:02 |
I |
9 |
−0.780 |
|
68 |
C*15:02 |
I |
9 |
−0.491 |
|
69 |
C*16:01 |
I |
9 |
−0.024 |
|
70 |
DPB1*01:01 |
II |
11 |
0.526 |
|
71 |
DPB1*02:01 |
II |
11 |
−0.714 |
|
72 |
DPB1*02:02 |
II |
10 |
−0.264 |
|
73 |
DPB1*03:01 |
II |
11 |
0.229 |
|
74 |
DPB1*04:01 |
II |
11 |
0.562 |
|
75 |
DPB1*04:02 |
II |
11 |
−0.271 |
|
76 |
DPB1*05:01 |
II |
11 |
0.405 |
|
77 |
DPB1*06:01 |
II |
10 |
0.247 |
|
78 |
DPB1*09:01 |
II |
9 |
−0.106 |
|
79 |
DPB1*10:01 |
II |
10 |
−0.715 |
|
80 |
DPB1*11:01 |
II |
9 |
−0.111 |
|
81 |
DPB1*13:01 |
II |
10 |
−0.649 |
|
82 |
DPB1*14:01 |
II |
11 |
−1.068 |
|
83 |
DPB1*17:01 |
II |
9 |
−0.201 |
|
84 |
DPB1*19:01 |
II |
11 |
0.245 |
|
85 |
DQB1*02:01 |
II |
12 |
0.459 |
|
86 |
DQB1*02:02 |
II |
11 |
−0.327 |
|
87 |
DQB1*03:01 |
II |
13 |
−0.693 |
|
88 |
DQB1*03:02 |
II |
13 |
0.748 |
|
89 |
DQB1*03:03 |
II |
13 |
0.812 |
|
90 |
DQB1*04:02 |
II |
13 |
0.615 |
|
91 |
DQB1*05:01 |
II |
13 |
0.267 |
|
92 |
DQB1*05:02 |
II |
10 |
−0.844 |
|
93 |
DQB1*05:03 |
II |
12 |
−0.682 |
|
94 |
DQB1*06:01 |
II |
11 |
−0.181 |
|
95 |
DQB1*06:02 |
II |
14 |
0.629 |
|
96 |
DQB1*06:03 |
II |
13 |
0.177 |
|
97 |
DQB1*06:04 |
II |
12 |
0.503 |
|
98 |
DQB1*06:09 |
II |
9 |
−0.707 |
|
99 |
DRB1*01:01 |
II |
14 |
0.838 |
|
100 |
DRB1*01:02 |
II |
11 |
−0.693 |
|
101 |
DRB1*01:03 |
II |
11 |
−0.550 |
|
102 |
DRB1*03:01 |
II |
13 |
−0.041 |
|
103 |
DRB1*04:01 |
II |
13 |
0.983 |
|
104 |
DRB1*04:02 |
II |
11 |
−0.692 |
|
105 |
DRB1*04:03 |
II |
12 |
−1.079 |
|
106 |
DRB1*04:04 |
II |
13 |
0.425 |
|
107 |
DRB1*04:05 |
II |
9 |
−0.166 |
|
108 |
DRB1*04:07 |
II |
12 |
−0.216 |
|
109 |
DRB1*04:08 |
II |
9 |
0.842 |
|
110 |
DRB1*07:01 |
II |
12 |
−0.581 |
|
111 |
DRB1*08:01 |
II |
13 |
0.623 |
|
112 |
DRB1*08:03 |
II |
11 |
0.042 |
|
113 |
DRB1*09:01 |
II |
12 |
0.668 |
|
114 |
DRB1*10:01 |
II |
14 |
0.035 |
|
115 |
DRB1*11:01 |
II |
14 |
−0.337 |
|
116 |
DRB1*11:02 |
II |
12 |
−0.533 |
|
117 |
DRB1*11:03 |
II |
12 |
−0.619 |
|
118 |
DRB1*11:04 |
II |
12 |
−0.611 |
|
119 |
DRB1*12:01 |
II |
13 |
0.478 |
|
120 |
DRB1*13:01 |
II |
14 |
0.423 |
|
121 |
DRB1*13:02 |
II |
14 |
0.470 |
|
122 |
DRB1*13:03 |
II |
10 |
−0.494 |
|
123 |
DRB1*13:05 |
II |
10 |
−0.651 |
|
124 |
DRB1*14:01 |
II |
14 |
−0.371 |
|
125 |
DRB1*15:01 |
II |
13 |
0.823 |
|
126 |
DRB1*15:02 |
II |
10 |
−0.771 |
|
127 |
DRB1*16:01 |
II |
10 |
−0.669 |
Note. The strongest associations are in bold.
Analysis of strength of r´
There were no statistically significant differences in the strength of r´ (|r´|) between the two HLA classes or among HLA genes (within Classes) (P > 0.3 for all comparisons, ANOVA).
Discussion
Here we used an immunogenetic epidemiological approach across 14 countries in Continental Western Europe to identify a population-level HLA profile consisting of protective and susceptibility alleles for MS. The results, which generally corroborate and extend existing literature regarding HLA susceptibility and protection in European populations, demonstrated a larger number of protective HLA alleles than susceptibility alleles, particularly for Class I HLA. These findings are discussed within the context of the role of HLA in pathogen elimination and autoimmunity.
The evolutionary role of Class II HLA is host protection from foreign pathogens via facilitation of antibody production and adaptive immunity; however, Class II HLA are also strongly associated with autoimmune diseases, including MS, in which autoantibodies target self-antigens15. While several non-mutually exclusive mechanisms have been proposed to explain the association of Class II HLA with autoimmune disorders15, the specific mechanisms that increase risk of MS among carriers of certain Class II HLA alleles remain inconclusive21,34. Nonetheless, it is well-established that Class II HLA, and DRB1*15:01 in particular, has a strong genetic predisposing effect on MS17-21. Consistent with the existing literature, a strong correlation between the population frequency of DRB1*15:01 and the population prevalence of MS was found here (r´ = 0.823). In addition, several additional HLA susceptibility alleles were identified, many of which exhibited even stronger associations with the population prevalence of MS including DRB1*01:01, DRB1*04:01, DRB1*04:08. In contrast, several Class II HLA alleles were shown to be highly protective against MS at the population level in the present study. Of the Class II HLA alleles, DRB1*14:01 has most consistently been associated with protection from MS in European populations17. Other Class II alleles such as DRB1*11 have been shown to be protective against MS in Brazilian35 and Canadian36 populations. Here, DRB1*14:01 as well as all of the DRB1*11 alleles were protective against MS. Some studies have reported protective effects for HLA-DRB1*01 and DRB1*1037; however, it appears these alleles are protective only in the presence of HLA-DRB1*15 and do not exert independent protective effects where as DRB1*14 and DRB1*11 exert dominant independent protection36. Consistent with those findings, we did not find protective effects for DRB1*01:01 or DRB1*10 in the present study. We did, however, identify several other alleles that appear to provide population-level protection against MS. Of the 26 Class II HLA protective effects observed here, the strongest protective effects were found for DRB1*04:03, DQB1*05:02, and DPB1*14:01.
Similar to the findings for Class II, both protective and susceptibility effects were observed for Class I HLA with regard to the population prevalence of MS. In light of the role of Class I HLA in pathogen elimination via signaling destruction of infected cells, the Class I protective effects observed here are presumably related to efficient pathogen elimination. Of the 45 protective Class I alleles, the strongest effects were observed for HLA-A*11:01, HLA- A*32:01, HLA-B*18:01, HLA-B*35:08, HLA-B*38:01, HLA-B*40:01, HLA-B*49:01, and HLA-B*51:01. Although several of these allele associations with MS appear to be novel, prior research has found protective effects for HLA-B*35:0838. Several studies including some in European cohorts using direct HLA genotyping have reported protective effects of A*0217; here, HLA-A*02 was not protective and was only weakly associated with MS prevalence. Although Class I HLA alleles were significantly more likely to be protective (i.e., negatively associated with MS prevalence), there were several Class I HLA alleles that were positively associated with MS. Of those, the strongest effects were observed for HLA-A*03:01, HLA-A*37:01, HLA-B*07:02, HLA-B*15:01, HLA-B*37:01, HLA-C*07:02, Some of these alleles (e.g., HLA-A*03:01 and HLA-B*07:02)39 have previously been shown to be associated with MS risk though the findings have been inconsistent particularly with regard to whether the associations with disease are independent or accounted for by linkage disequilibrium with other alleles (e.g., DRB1*15:01)17. Others appear to be newly identified susceptibility alleles. Several viral and non-viral mechanisms that have been proposed to explain the role of Class I HLA in autoimmunity15; although, as with Class II HLA involvement in MS, the specific mechanisms linking Class I HLA to MS risk are inconclusive21,39.
The strength of the current population-level study rests in the ability to evaluate the association of a large number of high-resolution Class I and Class II HLA alleles with MS prevalence across countries. In contrast to imputation methods which have been shown to have questionable accuracy and are often limited to 2-digit resolution17, HLA genotype data used in this study was determined by direct sequencing at high-resolution (4-digit). Given the highly polymorphic nature of HLA, low-resolution genotyping may mask important protein-level differences in disease associations. For instance, here we found that DRB*04:01 and DRB*04:04 and DRB*04:08 are positively associated with MS prevalence whereas DRB1*04:02, DRB1*04:03, DRB1*04:05, and DRB1*04:07 are protective (i.e., negatively associated). Similarly, DRB1*15:01 is highly associated with MS risk in the present study (and elsewhere) but DRB1*15:02 was found to be highly protective. Allele group (i.e., 2-digit) resolution obscures these important distinctions. In addition, this across countries immunogenetic epidemiological approach permits identification of alleles that are broadly relevant to MS within this geographic region.
The present findings must also be considered within the context of study limitations. First, these population-level findings lay the groundwork for their validation at the individual level to confirm the HLA-disease associations observed here. Second, it is unclear if the current findings regarding HLA-disease associations observed in these 14 Continental Western European countries extend to other regions. Third, previous research has identified haplotypes that are associated with MS, the most widely reported being HLA-DRB1*15:01–DQA1*01:02–HLA-DQB1*06:02. We did not evaluate the effect of haplotypes on MS risks and instead focused on the association of individual alleles on MS prevalence. Of note, recent research has demonstrated that the most widely recognized haplotype effects are indeed driven by a single allele - HLA-DRB1*15:0119. Finally, environmental factors have been shown to interact with HLA to influence MS risk8,9. An evaluation of interactions between 127 HLA alleles and environmental factors is beyond the scope of this paper. Future studies examining the influence of HLA and environmental factors represents an important area of research to help discern factors that contribute to MS that could potentially be mitigated to reduce MS risk.
Conclusion
It is widely accepted that MS is likely a result of genetic and environmental interactions. Here we have corroborated several prior findings and identified novel HLA genes that are associated with MS. Given the role of HLA in pathogen elimination and autoimmunity, these findings point to a contributory role of exposure to pathogens in the absence of protective HLA in underlying the inflammation and autoimmunity associated with MS.
References
- Walton C, King R, Rechtman L, et al. Rising prevalence of multiple sclerosis worldwide: Insights from the Atlas of MS. Mult Scler J. 2020; 26(14): 1816-21.
- Wallin MT, Culpepper WJ, Nichols E, et al. Global, regional, and national burden of multiple sclerosis 1990–2016: a systematic analysis for the Global Burden of Disease Study 2016. Lancet Neurol. 2019; 18(3): 269-85.
- Matthews PM, Roncaroli F, Waldman A, et al. A practical review of the neuropathology and neuroimaging of multiple sclerosis. Prac Neurol. 2016; 16(4): 279-87.
- Kister I, Bacon TE, Chamot E, et al. Natural history of multiple sclerosis symptoms. Int J MS care. 2013; 15(3): 146-56.
- Confavreux C, Vukusic S. The clinical course of multiple sclerosis. Handbook of Clinical Neurology. 2014; 122(3): 343-69.
- Milo R, Kahana E. Multiple sclerosis: geoepidemiology, genetics and the environment. Autoimmun Rev. 2010; 9(5): A387-94.
- Dobson R, Giovannoni G. Multiple sclerosis - a review. Eur J Neurol. 2019; 26(1): 27-40.
- Alfredsson L, Olsson T. Lifestyle and environmental factors in multiple sclerosis. CSH Perspect Med. 2019; 9(4): a028944.
- Olsson T, Barcellos L, Alfredsson L. Interactions between genetic, lifestyle and environmental risk factors for multiple sclerosis. Nat Rev Neurol. 2017; 13:25–36.
- Simpson S Jr, Blizzard L, Otahal P, et al. Latitude is significantly associated with the prevalence of multiple sclerosis: a meta-analysis. J Neurol Neurosurg Psychiatry. 2011; 82:1132–1141.
- Sanchez-Mazas A, Lemaître JF, Currat M. Distinct evolutionary strategies of human leucocyte antigen loci in pathogen-rich environments. Philos Trans R Soc Lond B Biol Sci. 2012; 367(1590): 830-9.
- Salamon H, Klitz W, Easteal S, et al. Evolution of HLA class II molecules: Allelic and amino acid site variability across populations. Genetics. 1999; 152(1): 393-400.
- Garamszegi LZ. Global distribution of malaria-resistant MHC-HLA alleles: the number and frequencies of alleles and malaria risk. Malar J. 2014; 13: 349.
- Singh R, Kaul R, Kaul A, et al. A comparative review of HLA associations with hepatitis B and C viral infections across global populations. World J Gastroenterol. 2007; 13(12): 1770-87.
- Gough SC, Simmonds MJ. The HLA region and autoimmune disease: associations and mechanisms of action. Curr Genomics. 2007; 8(7): 453-65.
- McFarland HF, Martin R. Multiple sclerosis: a complicated picture of autoimmunity. Nat Immunol. 2007; 8(9): 913-9.
- Hollenbach JA, Oksenberg JR. The immunogenetics of multiple sclerosis: A comprehensive review. J Autoimmun. 2015; 64: 13-25.
- Sawcer S, Hellenthal G, Pirinen M, et al. Genetic risk and a primary role for cell-mediated immune mechanisms in multiple sclerosis. Nature. 2011; 476(7359): 214.
- Sawcer S, Franklin RJ, Ban M. Multiple sclerosis genetics. Lancet Neurol. 2014; 13(7): 700-9.
- Baranzini SE, Oksenberg JR. The genetics of multiple sclerosis: from 0 to 200 in 50 years. Trends Genet. 2017; 33(12): 960-70.
- Sospedra M, Martin R. Immunology of multiple sclerosis. Ann Rev Immunol. 2005; 23: 683-747.
- Vlachopoulou E, Lahtela E, Wennerstrom A, et al. Evaluation of HLA-DRB1 imputation using a Finnish dataset. Tissue antigens. 2014; 83: 350–355.
- James LM, Georgopoulos AP. Immunogenetic epidemiology of dementia and Parkinson’s Disease in 14 continental European countries: shared human leukocyte antigen (HLA) profiles. J Immunological Sci. 2021; 5(2): 16-26.
- James LM, Georgopoulos AP. The human leukocyte antigen (HLA) DRB1*13:02 allele protects against dementia in continental Western Europe. J Neurol Neuromed. 2019; 4(5): 1-6.
- James LM, Georgopoulos AP. Tri-allelic human leukocyte antigen (HLA) protection against dementia. J Neurol Neuromed. 2020; 5(1): 12-17.
- James LM, Georgopoulos AP. Shared human leukocyte antigen (HLA) coverage in dementia and Parkinson’s disease. J Neurol Neuromed. 2020; 5(3): 45-54.
- Waubant E, Lucas R, Mowry E, et al. Environmental and genetic risk factors for MS: an integrated review. Ann Clin Transl Neurol. 2019; 6(9): 1905-1922.
- Lin R, Taylor BV, Simpson S Jr, et al. Association between multiple sclerosis risk-associated SNPs and relapse and disability--a prospective cohort study. Mult Scler. 2014; 20(3): 313-321.
- Capone F, De Vincentis A, Ferraro E, et al. The PNPLA3 rs738409 variant can increase the risk of liver toxicity in multiple sclerosis patients treated with beta-interferon. Clin Neurol Neurosurg. 2020; 197: 106166.
- Population Reference Bureau. 2016 world population data sheet with a special focus on human needs and sustainable resources. Population Reference Bureau, Washington, DC, 2016. https://www. prb.org/2016-world-population-data-sheet/. Accessed February 5, 2019.
- Gonzalez-Galarza FF, Christmas S, Middleton D, et al. Allele frequency net: a database and online repository for immune gene frequencies in worldwide populations. Nucleic Acid Res 2011, 39: D913–D919.
- Allele*Frequencies in Worldwide Populations [Internet]. Allele frequency net database (AFND) 2020 update. Liverpool, UK. Available from: http://allelefrequencies.net/hla6006a.asp
- Fisher RA. Statistical Methods for Research Workers. 13th ed. Edinburgh, Scotland: Oliver & Boyd; 1958.
- Ramagopalan SV, Ebers GC. Multiple sclerosis: major histocompatibility complexity and antigen presentation. Genome Med. 2009;1:
- Kaimen-Maciel DR, Reiche EM, Borelli SD, et al. HLA-DRB1* allele-associated genetic susceptibility and protection against multiple sclerosis in Brazilian patients. Mol Med Rep. 2009; 2: 993-998.
- Ramagopalan SV, Morris AP, Dyment DA, et al. The inheritance of resistance alleles in multiple sclerosis. PLoS genetics. 2007; 3(9): e150.
- Dyment DA, Herrera BM, Cader MZ, et al. Complex interactions among MHC haplotypes in multiple sclerosis: Susceptibility and resistance. Hum Mol Genet. 2005; 14: 2019–2026.
- The International Multiple Sclerosis Genetics Consortium., Moutsianas L, Jostins L, et al.Class II HLA interactions modulate genetic risk for multiple sclerosis. Nat Genet. 2015; 47: 1107–1113.
- FogdellâHahn A, Ligers A, Grønning M, et al. Multiple sclerosis: a modifying influence of HLA class I genes in an HLA class II associated autoimmune disease. Tissue antigens. 2000; 55(2): 140-8.